


Are you looking for the best AWS monitoring tools, or are you confused about which one will be the right choice for your organization?
If yes, you have stumbled upon the right webpage. This article will share a comprehensive guide to help you find the best AWS monitoring tool.
So, without any further ado, let’s get started –
AWS Cloud Monitoring Tools – What do we know about it?
AWS is the leading cloud service provider and offers easy scalability, high availability, and ease of use, making it a perfect choice to host your applications. It offers over 200 services, and thousands of startups, MNCs, and firms rely on it for their cloud service needs.
While AWS is known for offering simple-to-use tools and some compelling automatically managed services, some parts of the service still need to be monitored by you regularly for optimum performance.
AWS monitoring consists of a set of practices that includes systematically observing, collecting, inspecting, and tracking the progress and performance data of various AWS resources to ensure security and performance.
These practices involve implementing a set of services to verify the functionality, security, and performance at an acceptable level of your AWS assets.
Once you collect the data, you can use it to identify vulnerabilities and issues related to performance and configure it further to optimize your configuration.
AWS monitoring lets you examine regulatory compliance, infrastructure, metrics, complexity, logs, inventory, and events. It lets you optimize everything else, from network traffic security to server-side encryption and client security.
There are a lot of other benefits of using AWS monitoring tools that, include –
- It makes monitoring all your AWS cloud resources in a single dashboard easy.
- It makes it easy to detect inconsistencies in performance, operational excellence, security, and more so that you can make appropriate decisions to fix them.
- They help you get all the essential data and identify abnormal server behavior early on; you can fix problems before customers notice them or complain about them.
- These also let you easily manage the AWS stack without analyzing or overlooking its components.
- It allows you to monitor hybrid clouds and other on-prem infrastructure on the AWS cloud.
Such tools let you collect and log data that can provide insights for a strong business value. Plus, it allows you to trigger automatic actions to fix abnormal situations easily.
They can help you track the impact of scaling and other things that can help protect your infrastructure from overloading and unnecessarily scaling to avoid overspending and performance degradation.
So, that was everything about AWS monitoring tools and their benefits. Many other things need to be covered, such as the metrics the engineering team should monitor in AWS and some of the best practices that your team should follow to reduce the risk and maintain optimal performance.
We will talk about these things in the latter part of this article. But before that, let us share some of the AWS monitoring tools.
The good thing is that for AWS monitoring purposes, AWS offers a wide range of in-house tools that you can use.
First, we will cover the first-party monitoring tools, and after that, we will talk about some of the third-party tools you can use.
Best AWS Monitoring Tools – Our Top Pick👌
1. AWS CloudWatch
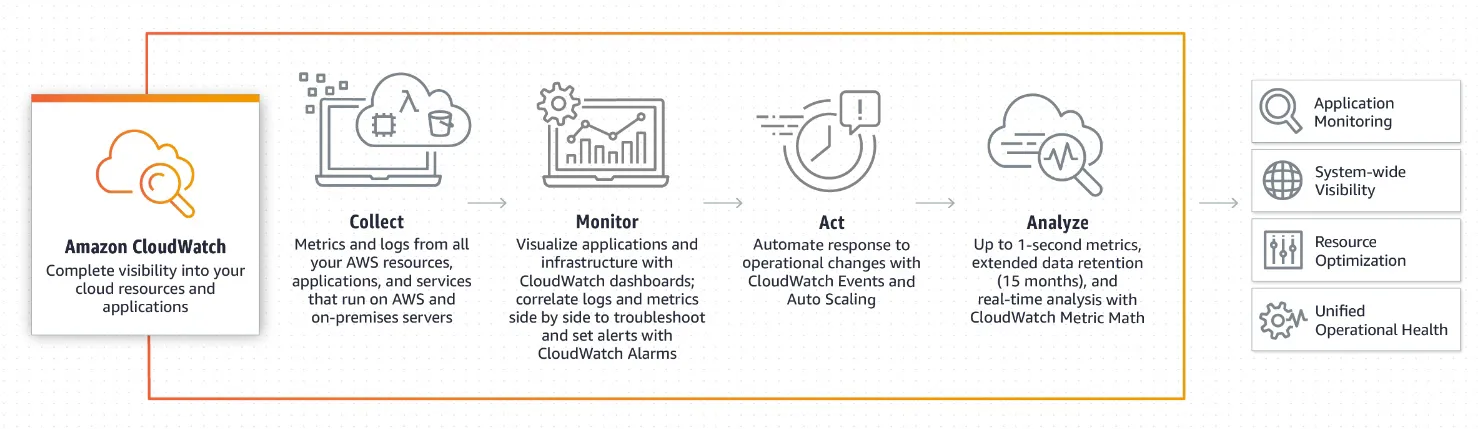
The very first AWS monitoring tool on our list is AWS CloudWatch. It is the native and essential tool of AWS that provides you with detailed, actionable insights for your AWS services.
While most of the AWS CloudWatch is free, some advanced monitoring functions might require you to pay some bucks. It is a tool for developers, DevOps engineers, IT managers, and SREs.
One of the best features of AWS CloudWatch is its CloudWatch Alarms. This feature allows you to set alarms for a wide range of metrics.
For example, you can set alarms for CPU utilization of your server’s EC2 instances. So, the alarm will be activated whenever the CPU utilization for those EC2 instances hits the specific limit you have configured.
You can further configure this alarm to automate specific tasks to heal the application environment. Plus, it also easily integrates with other services to help you analyze the behavior of your AWS services.
In addition to that, it helps you collect metrics, logs, events, applications, and other resources. This data allows you to monitor inconsistent behavior, visualize metrics and logs, troubleshoot errors, take automated actions, and more.
AWS CloudWatch also offers a clean dashboard called CloudWatch Logs, which gives you a detailed log archive of your AWS services.
By default, most of the AWS services are integrated with AWS CloudWatch Logs. However, if some services are not automatically integrated, you can manually configure them.
Along with AWS public cloud, you can also set up AWS CloudWatch on your on-prem architectures and hybrid cloud servers.
You can do that by simply installing and configuring the AWS CloudWatch agent.

2. AWS CloudTrail
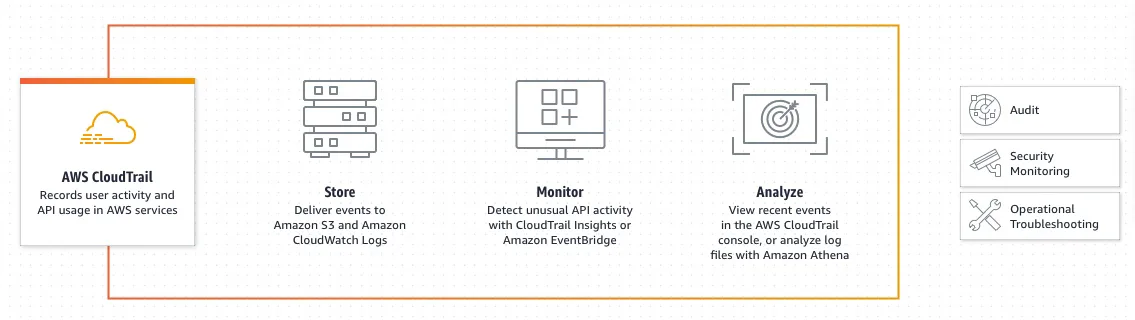
AWS CloudTrail is a service that allows you to monitor, survey, and perform operation auditing tasks. It records and monitors all event logs, activity logs, and other changes made to your AWS account and stores them in your Amazon Simple Storage Service (S3).
For instance, let’s say you created some IAM roles, but now they are deleted from your account. You can use AWS CloudTrail’s DeleteRole action to find the information about these deleted roles and filter out the results.
It will give you detailed information about the deleted roles, operations, and more.
AWS CloudTrail further collects data such as user identities, timestamps, traffic origin IPs, etc. With the help of this tool, you can easily log, monitor, and retain account activities associated with actions in your AWS infrastructure.
It provides you with detailed AWS account activity. Besides that, it also helps you manage the function performed using AWS Console, AWS SDKs, program line tools, and other AWS services.
This collected data makes it easy to perform security analysis, troubleshoot errors, and trailing resource amendments.
AWS CloudTrails also simplifies compliance audits by automatically monitoring, recording, and storing event logs.
You can further configure CloudTrail with AWS CloudWatch to easily search and analyze the log data to identify out-of-compliance events so that you can accelerate incident investigations and expedite responses to auditor requests.
AWS CloudTrail lets you view all management events, detailed data, and other information for the past 90 days.

3. AWS Config
AWS Config is another great tool offered by AWS that can help you with monitoring related needs. It provides a detailed inventory of various AWS resources and their latest configurations while regularly recording changes.
You can use it to evaluate configurations and changes on your AWS resource to make them compliant with ideal configurations defined by AWS Config rules.
This helps you review changes in your AWS configurations and relationships between AWS resources.
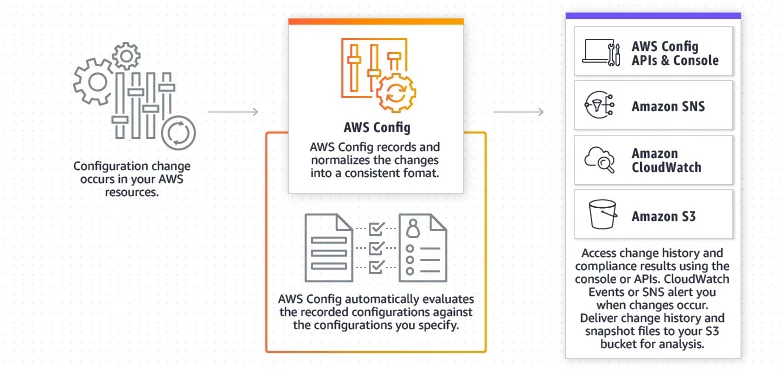
AWS Config provides detailed information on resource configuration histories and helps you understand the overall compliance against the user-defined customized rules and configuration.
This simplifies compliance auditing, change management, security analysis, and operational troubleshooting processes.
Unlike other monitoring tools, it doesn’t offer to see metrics and logs in the AWS Config dashboard. Instead, it allows you to create rules to audit, assess, and evaluate the configuration, and whenever a rule breach occurs, it will be highlighted in the Config console.
AWS Config can help you retrieve configurations from one or more resources in your account and historical configurations.
In addition to that, it enables you to see relevant relationships between resources and notifies you every time a new resource is created, modified, or deleted.
Third-party AWS Application Monitoring Tools:-
So, these were some of the best AWS in-house monitoring tools that you can use. These tools are great and make the monitoring process much easier, but as your application grows, the number of your AWS services also increases.
In such a scenario, finding correct information in AWS CloudWatch or CloudTrail becomes challenging and sometimes impossible.
In that situation, you can use third-party AWS monitoring tools that can help you monitor and analyze your AWS services and resources very efficiently.
So, here we have some of the best third-party AWS monitoring tools –
4. Datadog
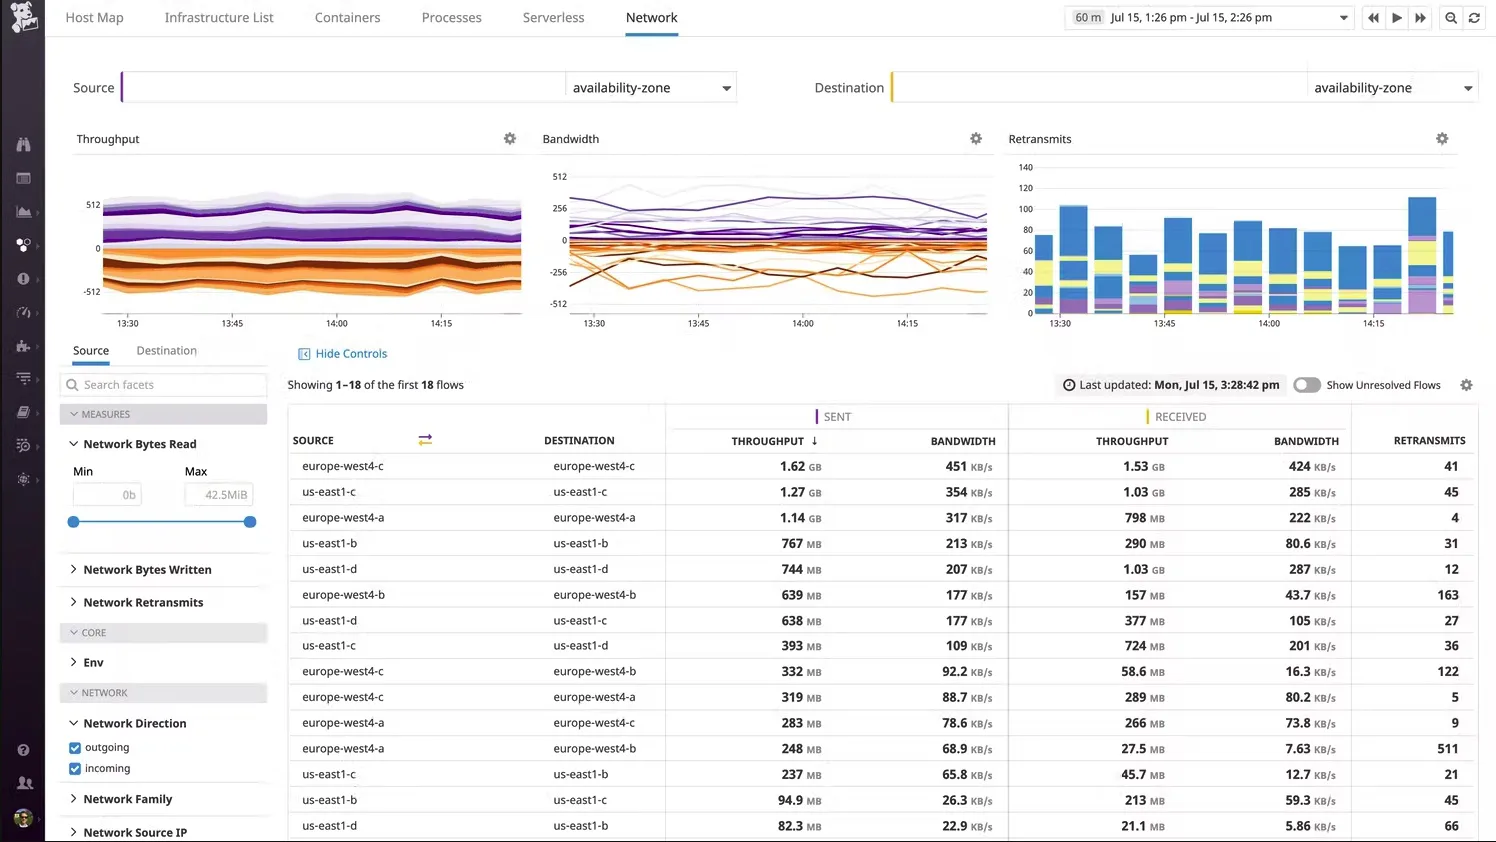
The very first third-party AWS monitoring tool on our list is Datadog. Datadog is not just a tool but a suite of over 200 monitoring tools and services, making it quite effortless to monitor every single component of your AWS stack.
Datadog is a SaaS platform that allows companies to detect and fix issues affecting end-users. This suite is best known for infrastructure monitoring-related tools, but it also boasts powerful tools that can help you with application performance monitoring.
Datadog is a relatively newer company in the market, but despite that, it has officially become an AWS Advanced Technology Partner. Due to its ease of use, Datadog is quite popular amongst startups and many enterprise technology companies.
The user interface of Datadog is quite simple and intuitive. You get a highly customizable dashboard where you can monitor and see everything you need for your AWS monitoring.
Datadog supports the integration of over 350 services and tools, allowing you to seamlessly collect all types of data and metrics you may need.
Further, Datadog boasts eight different types of monitors, including HTTP checks and threshold-based alerts. These monitors allow you to configure alerts based on different scenarios, such as specific thresholds, changes in metrics, anomaly detection, and more.
Besides that, it lets you create custom checks to get notified. For example, you can configure it to notify you when an application is crashing or not responding.
Another good thing about Datadog is that it is not restricted to AWS. You can install it on your on-prem infrastructure or hybrid servers. It is a premium tool, but you can opt for the 14 days trial plan to test its services.
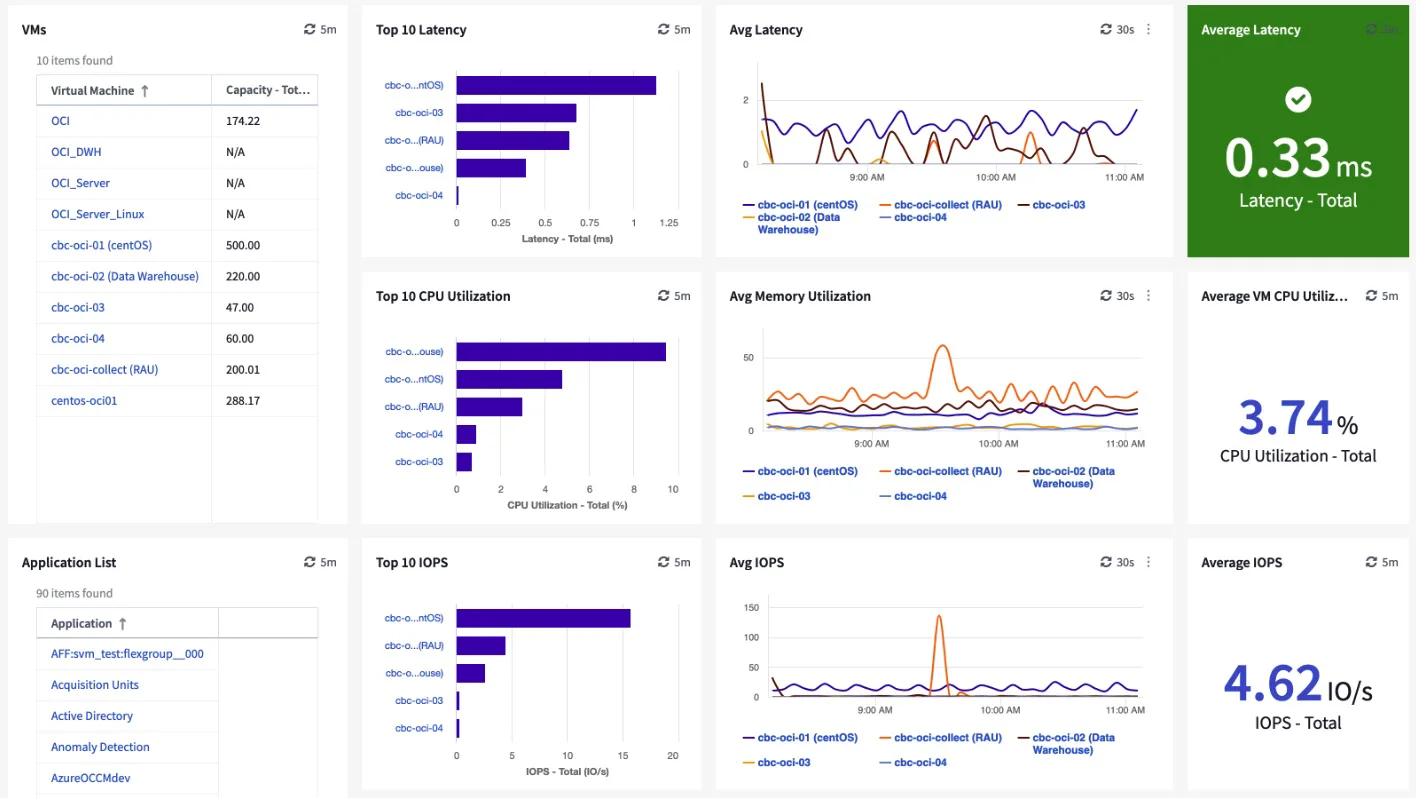
5. NetApp Cloud Insights
It is another AWS monitoring tool that gives you a detailed insight into your infrastructure and applications. This tool lets you monitor, troubleshoot, and optimize your AWS cloud resources and applications.
Along with AWS, NetApp Cloud Insights supports on-prem infrastructure and hybrid servers. You don’t have to worry about finding new monitoring tools every time you move your application from one place to another.
It also seamlessly integrates with Kubernetes, allowing you to easily identify resource constraints and performance issues, whether the issue is internal to the cluster or caused by other reasons.
Once it helps you identify the issue, you can fix it to manage resources more effectively.
NetApp Cloud Insights is also known for its security functionalities. Its powerful security system protects your data and applications from ransomware attacks by identifying them early and providing automated responses. It also regularly audits access and usage patterns to ensure corporate compliance.
This AWS monitoring tool also does a superb job of optimizing resource utilization. It helps by providing engineers and administrators with thorough information on resource usage to proactively reduce the wastage of resources and utilize them optimally to prevent performance bottlenecks while saving some bucks.
The dashboard you get with NetApp Cloud Insights is intuitive and highly customizable. By default, the UI of the dashboard covers everything, but you can customize it the way you want to prioritize the metrics that you want to see.
The alerting system is also quite robust as it features several options to get notified during the breaches, such as Email, Slack, ServiceNow, PagerDuty, and more.
To wrap it up, I would say that NetApp Cloud Insights is an amazing tool for monitoring, conditional alerting, resource optimization recommendations, ML-based anomaly detection, predictive analytics, and compliance auditing.
All these things make it a great monitoring tool for AWS or any other on-prem or public cloud per second.
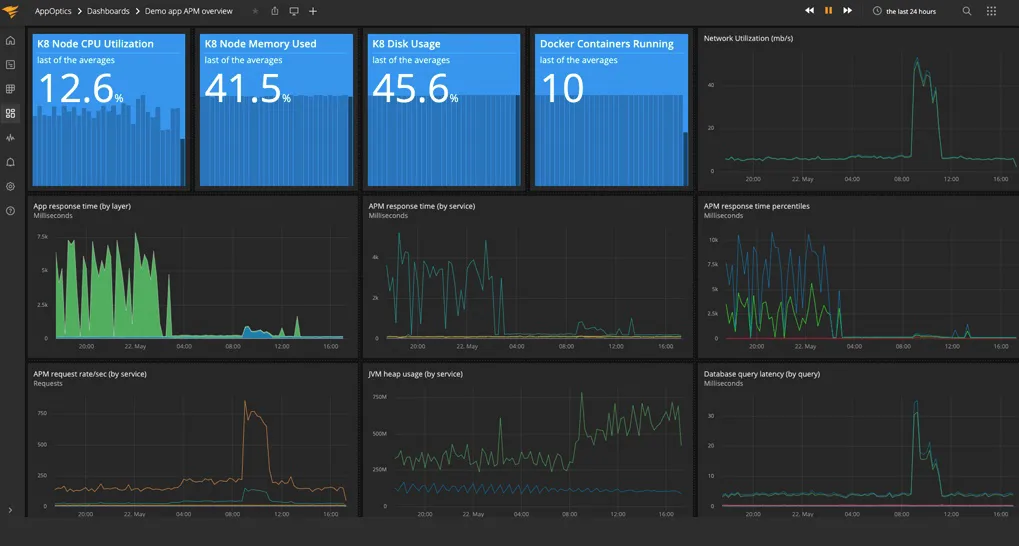
6. SolarWinds AppOptics
Next, we have SolarWinds AppOptics on our list. Similar to Datadog, AppOptics is not just a tool but a fully-fledged suite that can help you with a wide range of monitoring features. You can opt for this SaaS-based platform for infrastructure, application, and server monitoring.
SolarWinds AppOptics fully integrates with various services, including AWS and Azure, meaning you can easily use this tool for AWS monitoring purposes.
It further supports integrating a wide range of AWS tools and services, including AWS CloudWatch, AWS CloudSearch, EC2 Container Services, Lambda, and others.
You can integrate any other AWS service or tool you want to make it more functional and usable. Besides that, it supports a wide range of services and tools you may need for your applications, such as Nginx Cloud Search Plus, Glassfish, Elasticsearch, Consul, Docker, Big Panda, and more.
With the help of AWS CloudWatch, this tool can grab the real-time performance of your AWS resources. The default dashboard of AppOptics is quite intuitive and usable, especially for AWS monitoring. However, you can fully customize it and make it yours by adding new dashboards, creating custom tags, and more.
As an administrator, you can configure AppOptics to monitor different metrics. You can use default settings or customize them to grab metrics at specific intervals. It lets you add multiple accounts and unlimited instances and monitor them from a single dashboard.
It is also important to note that SolarWinds is one of the few advanced technology partners with AWS, meaning AWS officially endorses them.
This also means they have satisfied the advanced AWS requirements for customer satisfaction and product status.
7. ManageEngine Applications Manager
ManageEngine Application Manager is a great tool that you can use for AWS monitoring. It gives you end-to-end visibility of your AWS resources and applications. Along with AWS environments, it also supports other clouds and hybrid cloud architecture.
ManageEngine Application Manager closely monitors Amazon RDS and Amazon E instances to assess the health of your AWS resources, cloud performance, and utilization metrics of your AWS resources. Once it pulls the data, you can convert it to a graphical view for closer inspection.
When you use ManageEngine Application Manager to monitor Amazon E instances, it pulls a wide range of data, including instance ID, public DNS name, region name, health, availability, and more.
The health section of the data is color-coded, allowing you to easily get the idea if a service is about to go down in a single glance.
It also integrates with the Elastic Load Balancing service offered by Amazon to help you easily track the activities of the network load balancers, application load balancers, classic load balancers, and more.
Besides that, it also offers an RDS monitoring feature that lets you easily track the data of CPU utilization, latency metrics, traffic of RDS instances, database connections, and more.
All the information these tools pull is displayed in a very clear format. This allows you to understand what’s going on easily. On top of that, it supports REST API, which you can use to integrate other tools and pull custom metrics with the help of those monitoring tools.
The low maintenance approach of ManageEngine Application Manager makes it a worthy choice when looking for AWS monitoring tools.
However, it is a premium tool, but you can get a 30-day free trial if you want to test its features.
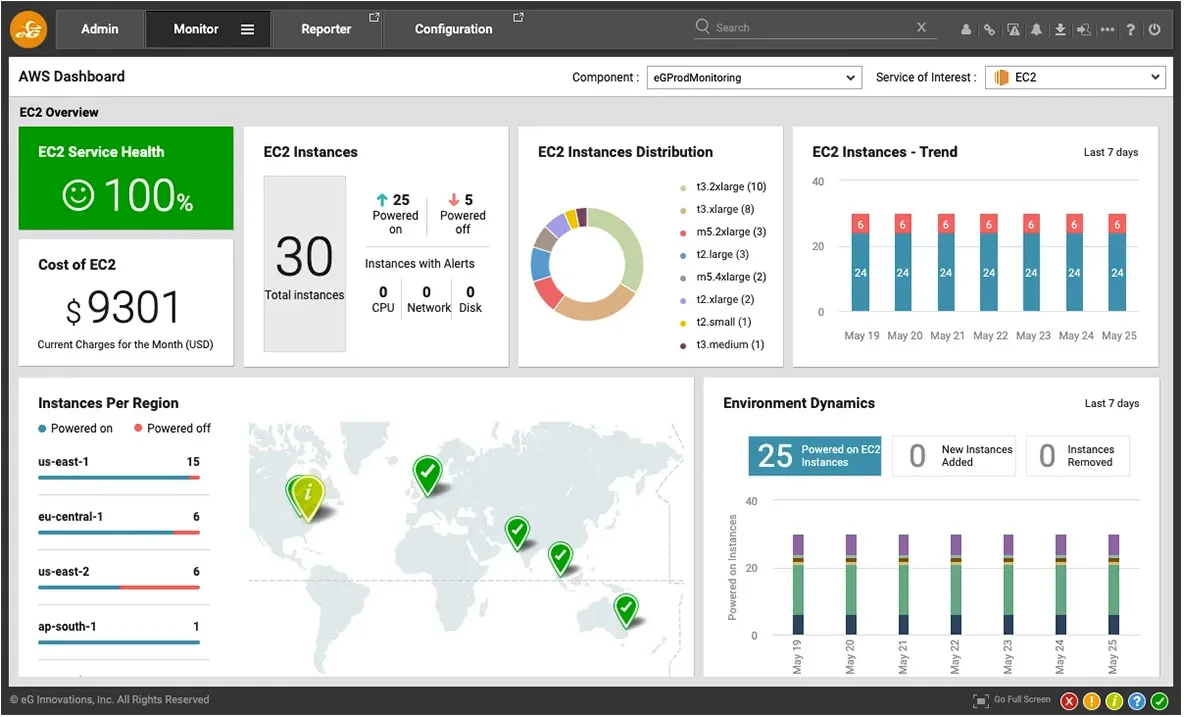
8. eG Innovations’ AWS Monitoring
While eG Innovation (Visit Here) offers an infrastructure and application monitoring package, while it is not primarily an AWS monitoring tool, you can configure it with AWS active integration. It can be done very easily with the help of a free extension.
The AWS monitoring with eG Innovation is agentless. It happens because it uses the AWS CloudWatch. However, you still have to configure to monitor your AWS services, but that is not a big deal.
Talking about this tool, it is really amazing and highly customizable. It provides you with a library of screens, and each of these screens pulls different types of metrics from your applications.
This makes it easy to find the possible root cause of the performance problems, allowing you to fix the issue ASAP.
The infrastructure monitoring tool pulls the performance data from your AWS resources or on-prem infrastructure. It is specialized in monitoring over 200 technologies, and probably, you will never need all of them.
To avoid your dashboard or menu getting crowded from the services that you are not using, it allows you to do product-specific monitoring.
It is quite simple as all you have to do is install the plugin of the technology or service you want, and you will only see that in your dashboard.
If I have to wrap it up, I would say eG Innovation’s SaaS service is amazing, but it would not be my primary choice for AWS monitoring.
That is because it is too powerful just for AWS monitoring. However, if you have to manage hybrid servers or have an on-prem infrastructure, you should consider it.
So, these are some of the great AWS monitoring tools you can use. We are about to wrap up this article, but before that, I would like to share some practices that can help you mitigate risk and maintain optimal performance.
AWS Monitoring Best Practices:-
1. Create policies to define priority levels
The first practice I recommend is creating policies as per their priority levels. For this, you can prioritize the AWS components for monitoring from the most essential to the least essential order. This can help you distribute the time and effort during normal operations and emergencies.
2. Monitor everything that you possibly can
If you have access to all of the data of your AWS resources, you can easily detect and troubleshoot errors. Therefore, monitoring almost everything you possibly can is recommended; if it gets challenging, automate.
3. Use automation where possible
Production deployments in AWS can be too large and dynamic and cannot be easily monitored manually. Even though you can do that, it will not be the right choice. Automating most of your monitoring tasks is the best practice for analyzing such massive data efficiently.
4. Resolve issues early on
I have often seen organizations set up AWS monitoring tools and then neglect to engage with the collected data proactively.
One good practice to maintain optimal performance is to analyze the collected data regularly to detect anomalies. When you find some issues, fix them before they cause any damage.
📗FAQ
What are the best AWS tools?
Some of the great AWS monitoring tools are Amazon Cloudwatch, Amazon Elastic Compute Cloud, Zabbix, solar wings, App Dynamics, Zenoss, Nagios, Datadog, Dynatrace, Splunk, AWS certificate manager, Applications manager, Performance Analyzer, Server Density limited, SolarWinds Paper Trail, Solarwinds Appoptics, Cloud watch, etc.
What is the main purpose of Cloudwatch?
CloudWatch gathers monitoring and Operational data. CloudWatch accumulates the data through logs, metrics, and events.
You can get a clear picture of the operational health and have complete clarity of the AWS applications, resources, and Services working on AWS and on-premises via CloudWatch.
What is the popular third-party monitoring tool for AWS?
Datadog is undoubtedly one of the most influential and valuable tools for monitoring AWS.
It is a SaaS platform for AWS resource monitoring and analytics that enables you to gather information about your application or quickly filter and analyze logs and metrics for troubleshooting.
What is AWS cloudtrail?
AWS CloudTrail tracks user activity and API usage; based on that, it enables auditing, security monitoring, and operational troubleshooting.
CloudTrail records retain account activity and note the actions across your AWS infrastructure; this is done to give you full control over storage, analysis, and corrective measures.
What is the difference between CloudTrail and CloudWatch?
Two different services offered by Amazon Web Services are Amazon CloudWatch and Amazon CloudTrail (AWS).
For many AWS resources, data and operational insights are provided by the completely managed monitoring service known as Amazon CloudWatch.
You can do real-time data collection, monitoring, and analysis to understand better how resources and applications are performing.
Amazon Elastic Compute Cloud (EC2) instances, Amazon Elastic Block Store (EBS) volumes, and Amazon RDS DB instances are just a few of the resources in AWS for which CloudWatch offers statistics and operational insights. Additionally, it offers to monitor for specific metrics that your applications and services generate.
On the other side, Amazon CloudTrail is a service that enables you to keep track of, record, and archive events connected to the activity of your AWS account.
The actions you do use the AWS Management Console, AWS SDKs, command-line tools, and other AWS services are all recorded by CloudTrail in your AWS account.
The user’s identity, the time the request was made, and the source IP address are all information that CloudTrail records about the request. Additionally, it keeps track of the service’s response elements.
In conclusion, CloudWatch is primarily used to monitor the efficiency and availability of your resources and applications.
In contrast, CloudTrail is mostly used to keep an eye on and audit the actions carried out within your AWS account.
Which tool can be used to monitor AWS service limits?
You can use AWS Trusted Advisor to monitor AWS service limits. You can use the services for free but only for a limited time, after which you will have to pay for all the services.
What is the monitoring tool in AWS?
AWS offers several essential monitoring tools, some of which are:-
Amazon CloudWatch:- For a variety of resources in AWS, this fully managed monitoring solution offers data and operational insights. You can do real-time data collection, monitoring, and analysis to understand better how resources and applications are performing.
Amazon CloudWatch Logs:- Your log files from Amazon Elastic Compute Cloud (EC2) instances, AWS CloudTrail, and other cloud resources can be monitored, stored, and accessed using this service.
AWS Health:– This service gives you consolidated access to information about the status and health of your AWS resources and any events that can affect their availability.
AWS Trusted Advisor:– The performance, affordability, security, and fault tolerance of your AWS resources can all be optimized with the help of this service, which offers best-practice advice.
Amazon CloudWatch Synthetics:- By mimicking actual user queries for your application, this service enables you to monitor its operation and availability.
How do I monitor my AWS resources?
There are several ways to keep an eye on your Amazon Web Services (AWS) resources:-
Use Amazon CloudWatch:– For a variety of resources in AWS, this fully managed monitoring solution offers data and operational insights. You can do real-time data collection, monitoring, and analysis to understand better how resources and applications are performing.
Use AWS Trusted Advisor:– The performance, affordability, security, and fault tolerance of your AWS resources can all be optimized with the help of this service, which offers best-practice advice.
Use Amazon CloudWatch Synthetics:– By mimicking actual user queries for your application, this service enables you to monitor its operation and availability.
Use AWS Health:– This service gives you consolidated access to information about the status and health of your AWS resources and any events that can affect their availability.
Use Amazon CloudWatch Logs:– Your log files from Amazon Elastic Compute Cloud (EC2) instances, AWS CloudTrail, and other cloud resources can be monitored, stored, and accessed using this service.
Use Amazon Inspector:- This service analyzes your Amazon Elastic Compute Cloud (EC2) instances’ network and host-level configurations to determine the security and compliance of your application.
Use Amazon CloudWatch Events:– This service can set up rules that respond automatically to changes in your AWS resources.
What is a popular 3rd party monitoring tool for AWS?
There are numerous external monitoring tools for Amazon Web Services (AWS).
Several well-liked choices include:-
Datadog:- This tool for cloud-based monitoring offers real-time insight into the functionality of your infrastructure, applications, and logs. Amazon EC2, Amazon RDS, Amazon S3, and many other AWS services are integrated with it.
New Relic:– This tool for cloud-based performance monitoring offers real-time insight into the functionality of your infrastructure, users, and apps. Amazon EC2, Amazon RDS, and Amazon S3 are just a few of the AWS services that it interfaces with.
AppDynamics:- This is a cloud-based monitoring software that gives you real-time insight into how well your users, infrastructure, and apps are doing. Amazon EC2, Amazon RDS, and Amazon S3 are just a few of the AWS services that it interfaces with.
Splunk:– AWS services like Amazon EC2, Amazon RDS, and Amazon S3 are included in this data analytics platform, which enables you to track, search, examine, and display data from any source.
Zabbix:- A real-time view of the functionality of your infrastructure, apps, and services is offered by this open-source monitoring platform. Amazon EC2, Amazon RDS, and Amazon S3 are just a few of the AWS services that it interfaces with.
What is AWS monitoring?
AWS monitoring is the procedure of gathering, examining, and deciphering information regarding the functionality and accessibility of your resources and applications within Amazon Web Services (AWS).
The purpose of AWS monitoring is to ensure that your resources and apps are working effectively and to spot and resolve any possible problems before they impact your business.
Amazon CloudWatch, AWS Trusted Advisor, Amazon CloudWatch Synthetics, AWS Health, and Amazon CloudWatch Logs are just a few of the tools and services that AWS offers to assist you in keeping an eye on your resources and programs.
With the help of these tools, you may gather information on the efficiency and accessibility of your resources, set up alerts and notifications, and take corrective action if any problems develop.
Managing and operating your cloud-based infrastructure and apps requires careful attention to AWS monitoring.
It enables you to decide how to scale and optimize your resources to suit the demands of your business while assisting you in ensuring the performance and availability of your resources and applications.
What AWS tool could you use to monitor AWS account activity?
Amazon CloudTrail can be used to monitor activity in AWS accounts. With the help of Amazon CloudTrail, you may keep track of, document, and archive events that pertain to using your AWS account.
It offers a history of activities in your AWS account, including choices made using the AWS Management Console, AWS SDKs, command-line programs, and other AWS services.
You can keep an eye on activities by using CloudTrail to:-
1. Adding and removing resources
2. alterations to the resource configuration
3. Sign-in activities for the management console and resource access
Each request’s details, including the user’s identity, the request’s time of submission, and the source IP address, are recorded by CloudTrail. Additionally, it keeps track of the service’s response elements.
It is simple to retrieve and analyze CloudTrail logs because they are kept in an Amazon S3 bucket. To ensure that your resources are being utilized and accessed responsibly, you can use CloudTrail to monitor activities in your AWS account.
It is a crucial tool for monitoring security and compliance and resolving and debugging problems in your AWS setup.
What is DataDog vs CloudWatch?
Two separate tools are used for tracking and evaluating the functionality of cloud-based resources and applications: Datadog and Amazon CloudWatch.
A cloud-based monitoring tool called Datadog offers real-time insight into the functionality of your infrastructure, applications, and logs. Amazon Web Services is just one of the many cloud services it interfaces with (AWS).
With features like dashboards, alerting, and interfaces with well-known tools and services, Datadog enables you to gather, monitor, and analyze data from various sources on a single platform.
Amazon CloudWatch, on the other hand, is a monitoring service entirely controlled and offered by AWS. You can do real-time data collection, monitoring, and analysis to understand better how resources and applications are performing.
Amazon Elastic Compute Cloud (EC2) instances, Amazon Elastic Block Store (EBS) volumes, and Amazon RDS DB instances are just a few of the resources in AWS for which CloudWatch offers statistics and operational insights.
Additionally, it offers to monitor specific metrics that your applications and services generate.
In conclusion, CloudWatch is a native AWS monitoring service specially made to monitor and analyze data from AWS resources.
In contrast, Datadog is a third-party monitoring solution that can track and analyze data from various sources, including AWS.
Is Splunk better than Datadog?
While Datadog is a monitoring platform that gives you real-time visibility into the operation of your infrastructure, apps, and logs, Splunk is a data analytics platform that is primarily focused on gathering, indexing, and analyzing data. Your unique demands and requirements will determine which tool is ideal for your business.
Is there a SIEM in AWS?
The security information and event management (SIEM) tool AWS Security Hub is provided by Amazon Web Services (AWS).
The on-premises and cloud environments and your AWS accounts are visible through the AWS Security Hub, a platform for centralizing security management.
It gathers, arranges, and prioritizes security warnings and discoveries from various AWS services, including Amazon GuardDuty, Amazon Inspector, and Amazon Macie, in addition to third-party products.
AWS Security Hub offers several services to assist you in managing your security posture and enables you to discover and respond to security issues, including:-
1. Live visibility of security findings and warnings
2. Integration with AWS services and external products
3. individualized reporting and dashboards
4. incident reaction automation
The AWS Security Hub is an effective tool for monitoring and securing your AWS environment, and it can help you ensure you comply with all applicable laws and standards. Any organization’s cloud security strategy should include it as a key component.
What is AWS equivalent of Azure monitor?
The same as Azure Monitor, CloudWatch enables you to configure alerts and notifications based on predetermined thresholds or patterns in your data.
It also offers interaction with other AWS services, including Amazon CloudWatch Logs, AWS CloudTrail, and AWS Health, to assist you in managing and monitoring your cloud-based resources and applications.
How do I monitor AWS data pipeline?
You can keep an eye on your AWS Data Pipeline resources with Amazon CloudWatch.
You can gather, monitor, and analyze data in real-time to gain visibility into resource and application performance using Amazon CloudWatch, a fully managed monitoring solution offered by Amazon Web Services (AWS).
You can take these steps to keep an eye on your AWS Data Pipeline resources:-
Enable CloudWatch logging for your Data Pipeline resources:- Your Data Pipeline resources can submit log data to CloudWatch Logs by enabling CloudWatch logging. You will then be able to track and examine the log data produced by your Data Pipeline resources.
Set up CloudWatch alarms:– When specific thresholds are crossed, or trends are found in the data from your Data Pipeline resources, you may set up CloudWatch alarms to alert you. This can assist you in quickly identifying and resolving any possible resource-related problems.
Use CloudWatch Metrics:– The number of active pipelines, the number of tasks operating, and the task success or failure rate are just a few metrics that CloudWatch offers for your Data Pipeline resources. You can keep an eye on the efficiency and accessibility of your Data Pipeline resources using these metrics.
By utilizing CloudWatch to keep an eye on your Data Pipeline resources, you can better understand their performance and availability and take steps to scale and optimize them as necessary.
What is the difference between Kibana and Splunk?
While Splunk is a data analytics platform made to gather, index, and examine data from various sources, Kibana is an open-source data visualization tool primarily used for visualizing and analyzing data stored in Elasticsearch.
Both programs give users various visualization options and let them build their dashboards. Still, Splunk is typically regarded as a more robust and adaptable platform with a wider range of features.
What are open source aws monitoring tools available?
For administering and monitoring resources and applications in AWS, there are several open-source tools available:-
Zabbix:– Zabbix is a free and open-source platform for monitoring that offers real-time insight into the functionality of your infrastructure, applications, and services.
It interfaces with numerous AWS services, such as Amazon Simple Storage Service, Amazon Relational Database Service, and Amazon Elastic Compute Cloud (EC2) (S3).
Nagios:– An open-source platform for monitoring called Nagios gives you immediate access to information on the functionality of your infrastructure, programs, and services. Amazon EC2, Amazon RDS, and Amazon S3 are just a few of the AWS services that it interfaces with.
Prometheus:- Providing real-time visibility into the performance of your infrastructure, apps, and services is the open-source monitoring and alerting platform known as Prometheus. Amazon EC2, Amazon RDS, and Amazon S3 are just a few of the AWS services that it interfaces with.
Grafana:– With the help of the open-source data visualization tool Grafana, you can build dynamic dashboards for visualizing and analyzing data from many sources, including AWS. Amazon EC2, Amazon RDS, and Amazon S3 are just a few of the AWS services that it interfaces with.
CloudWatch Agent:- The Amazon Web Services (AWS) CloudWatch Agent is an open-source application that lets you gather system-level data from your Amazon EC2 instances and on-premises servers and submit them to CloudWatch.
Closing Comments
There you have it – a detailed article on AWS monitoring tools.
AWS monitoring tools are the best ways to ensure that you get the best results from the resources you are paying for without affecting industry norms.
However, you first have to figure out which AWS monitoring tool will be the right choice for you and then strategize your entire process for efficient monitoring.
We hope the tools and practices mentioned in this article will help you with your AWS monitoring tasks.