


In today’s dynamic business landscape, harnessing the power of data analytics is paramount for informed decision-making and propelling organizational growth.
While Power BI has established itself as a dominant force in the realm of business intelligence (BI) tools, it’s essential to explore alternative options that can better cater to your unique requirements and objectives.
Introducing a curated selection of Power BI alternatives that transcend the traditional boundaries of data analytics.
These cutting-edge tools offer a seamless blend of powerful data visualization, advanced analysis capabilities, and enhanced user experiences.
Embracing these alternatives allows you to unlock the full potential of your data and gain meaningful insights that drive impactful decisions.
What is Power BI?🤷♂️
Power BI is among the market leaders in business analytics platforms. The software is suitable for organizations with data analysts who demand information when its needs arise.
The software promotes self-service and provides institution-level analytics. Power BI is a Microsoft product.
It uses the MS ecosystem, including Azure and Office 365, and a proprietary formula and query language called DAX. Power BI has launched six packages named, Desktop, Pro, Premium, Mobile, Embedded, and Report Server.
Power BI gives the choice of creating visually appealing reports and customized charts. These reports can be directly embedded in blogs and websites. The interface is fully secured with end-to-end encryption.
Power BI is suitable for a variety of users. The primary users of this software are business intelligence professionals. This builds a framework for data to be used. Power BI has often been used to check progress about the team’s performance progress.
While this software has many advantages, there are plenty of limitations. Power BI requires proper technical assistance. People who know DAX must help non-tech people set up and solve other queries.
If no such engineers are available, employees must be trained in certain languages to use this software efficiently. This, in turn, leads to additional training costs and is a time-consuming process.
Since there are so many versions of this one software, it becomes hard for its users to understand where to begin and what should be the area of focus.
This confusion can delay the decision-making process for essential matters. The distinctive design of this software makes it more suitable for MS devices and not MAC devices.
Since the software is used most of the time to handle large amounts of data, processing it takes a long time. There are many different features in the various versions of this software.
However, not many free features are available for users. People with only specific packages like Pro or Premium can access features like cross-organization communication.
Due to the limitations listed above, users constantly look for better alternatives. This is where we are here to help you. We have made a list of the best Power BI Alternatives for you.
Best Microsoft Power BI Alternatives – Our Pick👌
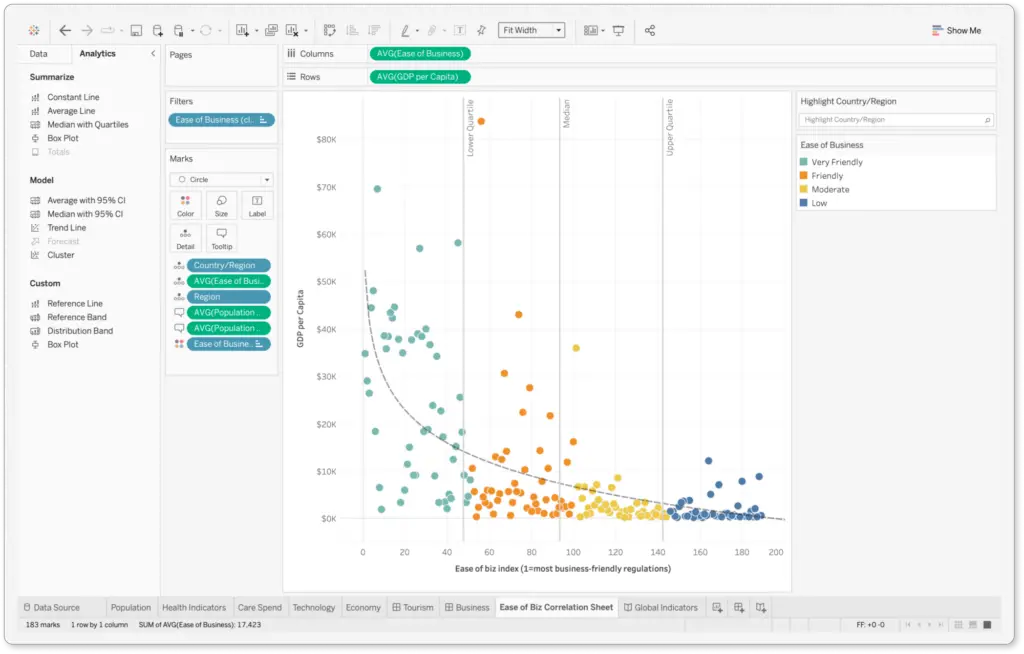
1. Tableau
Tableau and Power BI are popular data visualization tools businesses and organizations use to make sense of their data. While they have many similarities, they also have some key differences.
One of the main differences between Tableau and Power BI is their approach to data modeling.
Tableau is known for its flexibility in allowing users to build complex data models and create custom calculations, while Power BI is more structured in its approach to data modeling.
Another difference is their user interfaces. Tableau has a more intuitive and user-friendly interface, while Power BI has a steeper learning curve but offers more advanced customization options.
Ultimately, the choice between Tableau and Power BI will depend on the specific needs of your business or organization.
If you need a tool that is easy to use and has a lot of built-in functionality, Tableau might be the better choice.
Power BI might be the better choice if you need a tool that can handle more complex data modeling and customization.
Power BI vs Tableau:-
Power BI may be the better choice if you are looking for a data visualization tool that is easy to use and has strong data modeling capabilities.
On the other hand, if you need a more robust tool with advanced data analysis and visualization features, Tableau may be the better option.
Here is a detailed table comparing Power BI and Tableau:-
| Criteria | Power BI | Tableau |
|---|---|---|
| Developer | Microsoft Corporation | Tableau Software Inc. |
| Initial release date | July 2015 | May 2003 |
| Latest version | March 2023 (Version 3.1) | March 2023 (Version 2022.4) |
| Pricing | Free (with limited features), $9.99/user/month (for Power BI Pro) | $12/user/month (for Tableau Creator), $35/user/month (for Tableau Explorer), $70/user/month (for Tableau Viewer) |
| Data sources supported | Over 100 different data sources, including Excel, SQL Server, Oracle, and Salesforce | Over 80 different data sources, including Excel, SQL Server, Oracle, and Salesforce |
| Data Visualization | Intuitive and easy to use, with powerful visuals and a drag-and-drop interface | Powerful and customizable, with a wide range of charts and graphs available |
| Data Transformation | Offers a wide range of data transformation options, including Power Query and DAX functions | Offers data transformation through Tableau Prep |
| Sharing and Collaboration | Allows for easy sharing and collaboration through the Power BI Service, which offers a range of sharing options, including embedding, publishing, and exporting to PDF or PowerPoint | Offers a range of sharing and collaboration options, including publishing to Tableau Server or Online, embedding, and exporting to PDF or PowerPoint |
| Customization | Offers a high degree of customization through a range of custom visuals, themes, and templates | Offers a high degree of customization through a range of custom visuals, themes, and templates |
| Mobile Compatibility | Available as a mobile app for iOS, Android, and Windows devices | Available as a mobile app for iOS and Android devices |
| User Community | Large and active community, with extensive documentation and resources available | Large and active community, with extensive documentation and resources available |
| Learning Curve | Easy to learn and use, with extensive training resources available | Steeper learning curve compared to Power BI, but offers extensive training resources |
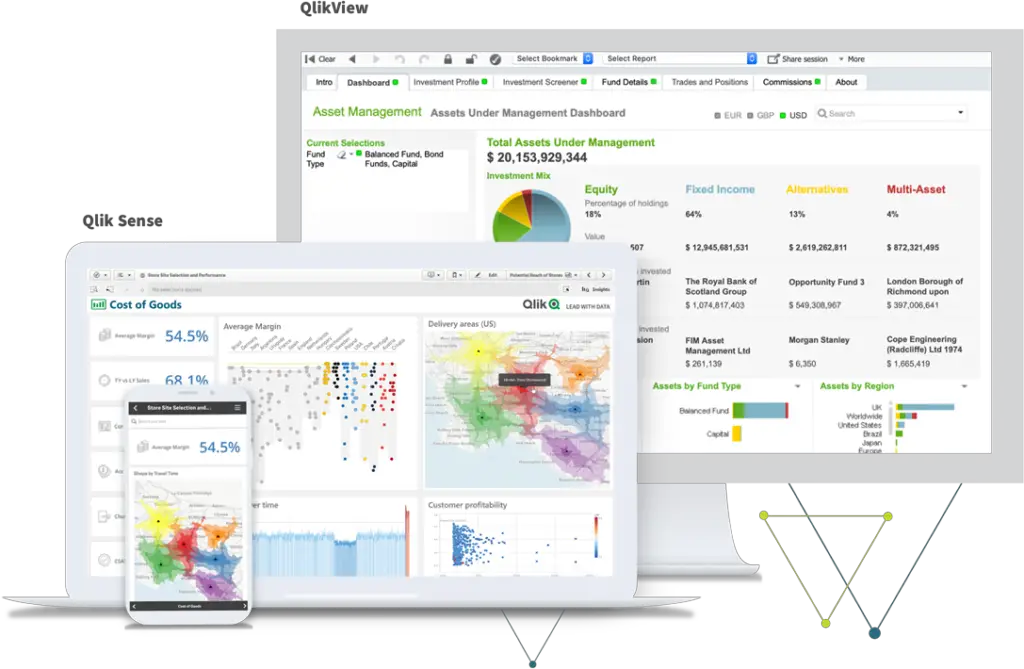
2. QlikView
QlikView can be considered a Power BI alternative. QlikView and Power BI are business intelligence and data visualization tools that enable users to analyze and visualize data.
They both offer various features that help organizations to make data-driven decisions. However, there are some key differences between the two tools.
QlikView is known for its powerful data discovery capabilities, which allow users to explore and analyze large amounts of data easily.
It has an associative data model, which enables users to link data together and make associations between different data sets. QlikView also offers advanced data visualization options, including interactive charts and graphs.
On the other hand, Power BI is a more modern and user-friendly tool that is easier to use and learn. It offers various visualization options, including customizable charts, graphs, and dashboards.
Power BI also integrates seamlessly with other Microsoft tools, such as Excel and SharePoint, making it an ideal choice for organizations already using these tools.
In conclusion, while both QlikView and Power BI offer similar features and functionalities, the choice between the two ultimately depends on the specific needs and requirements of your organization.
You should evaluate both tools and compare their features before making a decision.
Power BI vs QlikView:-
Power BI may be the better choice if you require a more user-friendly interface, powerful data preparation tools, and affordable pricing.
However, QlikView may be better if you need robust enterprise-level capabilities and a larger budget.
Here’s a detailed comparison table between Power BI and QlikView:-
| Feature | Power BI | QlikView |
|---|---|---|
| Company | Microsoft Corporation | QlikTech International AB |
| Release Date | July 24, 2015 | 1993 |
| Type of Tool | Business Intelligence and Analytics | Business Intelligence and Analytics |
| Deployment Options | Cloud-based, On-premise, Hybrid | Cloud-based, On-premise, Hybrid |
| Data Visualization | Modern, Interactive, Attractive, Supports custom visuals | Interactive, Supports custom visuals |
| Data Sources | Supports 90+ data sources, including cloud and on-premise databases, Excel, SharePoint, Salesforce, Google Analytics, and others. | Supports various data sources, including cloud and on-premise databases, Excel, Access, SAP, Salesforce, Google Analytics, and others. |
| Data Transformation | Provides basic data transformation options, including filtering, sorting, and grouping. | Provides advanced data transformation options, including joining, linking, and scripting. |
| User Interface | Intuitive and easy-to-use interface with drag-and-drop functionality. | Advanced and complex interface with a steep learning curve. |
| Data Modeling | Offers basic data modeling capabilities. | Offers advanced data modeling capabilities to link and associate data from different sources. |
| Collaboration | Supports collaboration through sharing, commenting, and integration with Microsoft Teams. | Supports collaboration through sharing, commenting, and integration with other tools like SharePoint, JIRA, etc. |
| Mobile Support | Offers native mobile apps for iOS and Android devices. | Offers native mobile apps for iOS and Android devices. |
| Security and Governance | Offers role-based security, data encryption, and Azure Active Directory integration. | Offers granular security and governance features, including data encryption, access controls, and auditing capabilities. |
| Learning and Community | Provides extensive documentation, tutorials, and training resources. | Provides extensive documentation, tutorials, and training resources. |
| Pricing | Offers a free and paid version with pricing starting at $9.99 per user per month. | Offers a free and paid version with pricing starting at $30 per user per month. |
| Pros and Cons | Pros: Easy to use, visually appealing, strong integration with Microsoft ecosystem. Cons: Limited data modeling capabilities, steep learning curve for advanced users. | Pros: Advanced data modeling capabilities, powerful scripting capabilities, and granular security and governance features. Cons: Steep learning curve, complex interface. |
3. Sisense
A business intelligence tool that provides AI-based analytics results to companies in a convenient manner is popularly known as Sisense.
The cloud-based software allows its users to gain fruitful data key points.
These key points are essential for making long-term strategic plans. These strategic plans act as the foundation of the business for the coming years.
The data that is collected is analyzed thoroughly for accurate decision-making. Sisense helps combine all the essential data in a professionally presentable manner with dashboards that require participation from the audience.
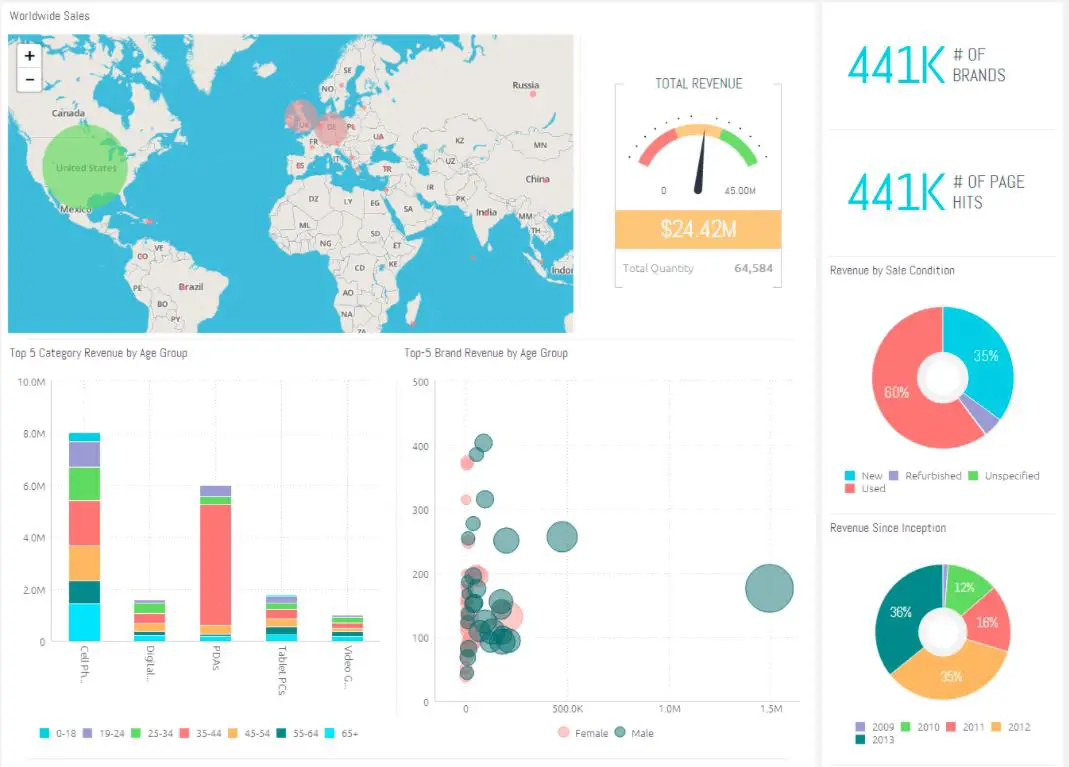
The interface mechanism of drag and drop makes it convenient for the software to access reports quickly. It also allows users to distribute valuable information to clients and business partners.
Sisense can be connected with any other data source due to the availability of its ElastiCube interface.
This software is perfectly suitable for large teams dealing with vast data. According to the user level, the complexity of the software can be adjusted.
Power BI vs Sisense:-
Both tools offer powerful data analysis and visualization capabilities. Still, Power BI may be a better fit for smaller teams or those looking for a more user-friendly interface, while Sisense may be a better fit for larger organizations or those with more complex data needs.
Here is a detailed table comparing Power BI and Sisense across various aspects:-
| Criteria | Power BI | Sisense |
|---|---|---|
| Data Connectivity | Supports many data sources, including cloud-based and on-premises data sources such as Excel, SQL Server, SharePoint, and more. | Supports over 100 data connectors for cloud-based and on-premises data sources such as CSV, Excel, JSON, Google Analytics, MongoDB, and more. |
| Data Visualization | Offers a variety of visualization options, including charts, tables, maps, and gauges. Allows users to customize colors, styles, and formatting options. | Offers advanced visualization options such as animations, geospatial mapping, and AI-powered analytics. Allows users to create custom visualizations using JavaScript and D3.js libraries. |
| Data Modeling | Users can create relationships between tables, define calculated columns and measures, and create hierarchies. | It offers a unique ElastiCube technology that allows users to perform complex data modeling tasks without needing advanced SQL skills. |
| Collaboration | Offers collaboration features such as sharing and commenting on reports, real-time co-authoring, and version control. | Offers collaborative features such as commenting, annotations, and real-time collaboration on dashboards. |
| Security | Offers security features such as row-level security, Azure Active Directory integration, and encryption at rest and in transit. | Offers security features such as user authentication, granular user permissions, and encryption at rest and in transit. |
| Pricing | Power BI Desktop is free to download, while Power BI Pro and Power BI Premium are available as paid subscriptions. | Offers a range of pricing options, including a free trial, a pay-per-user model, and a fully-managed cloud deployment. |
| Ease of Use | Offers a user-friendly interface with drag-and-drop functionality and pre-built templates. | Offers a user-friendly interface with a drag-and-drop editor, a user-friendly dashboard builder, and pre-built templates. |
| Support | Offers a robust community forum, documentation, and support from Microsoft. | Offers 24/7 customer support, a knowledge base, and a dedicated customer success team. |
| Integration | Integrates seamlessly with other Microsoft products such as Office 365, SharePoint, and Dynamics 365. | Integrates with various third-party applications such as Salesforce, Slack, and Zapier. |
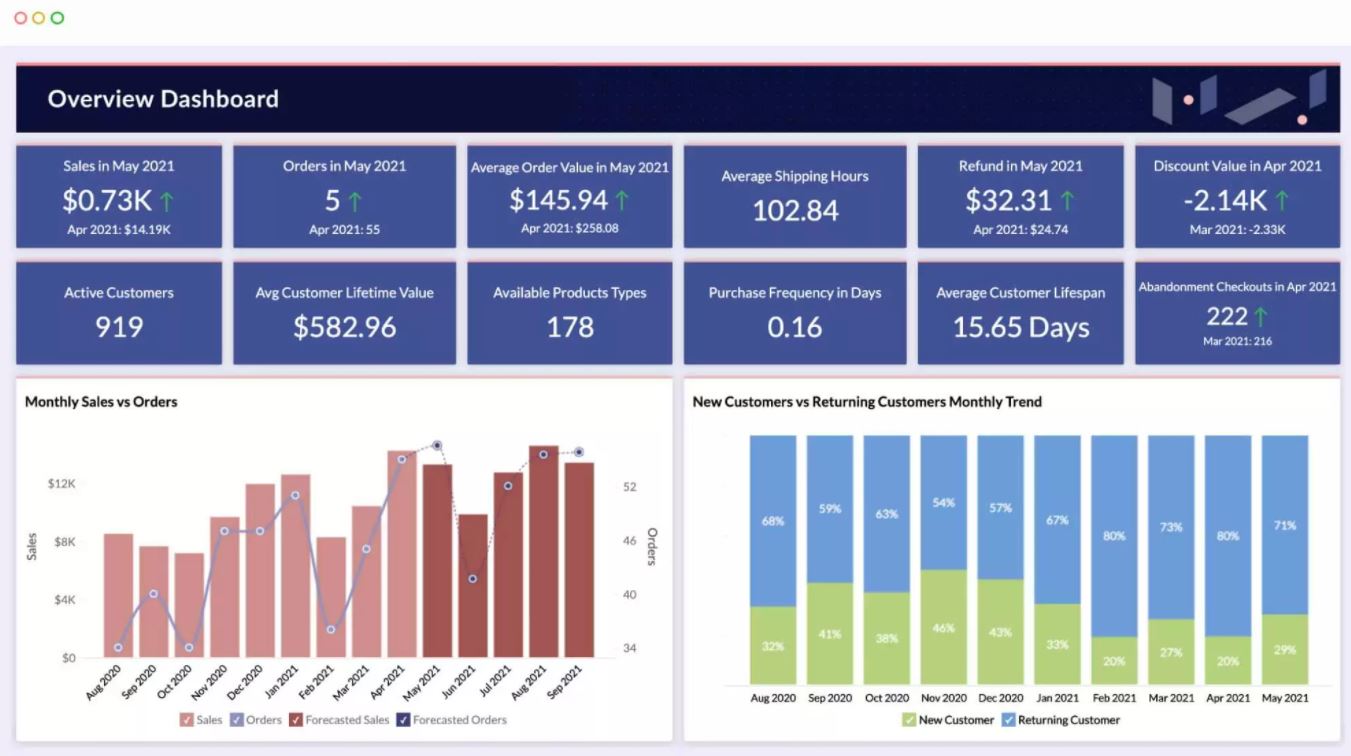
4. Zoho Analytics
Zoho Analytics, initially known as Zoho Reports, is one of the best Power BI alternatives and dynamic business intelligence tools. It is one of the top competitors of Microsoft’s Power BI and Google’s Data Studio.
Zoho is a technological company with a diversified line of tools and services. The software is a self-hosted business intelligence tool that helps users experiment with data.
Zoho Analytics makes a dashboard for a straightforward interpretation of data by providing attention-grabbing visuals.
Setting up this software is uncomplicated and does not require a long time. People with basic technical know-how can also use this software without much difficulty.
The software allows the user to check the organization’s performance regularly. The institution’s objectives and recent market trends can also be kept under check by using this tool.
The user interface of Zoho Analytics is similar to that of Excel. It has an in-built instant report designer with a drag-and-drop mechanism.
The software is suitable not only for large companies but also for small enterprises with limited resources. The software’s well-functioning data filters provide the user with appropriate data by eliminating false data.
The analytical tool can be attached to mobile applications, products, websites, or portals to securely and easily share data reports.
Its distinctive characteristic of data merging creates multifunctional pieces by gathering data from many sources.
Its in-app formula engine is useful for dealing with various complex statistical equations.

Power BI vs Zoho Analytics:-
Power BI may be the better choice if you’re already using other Microsoft products and need a tool with advanced customization options.
If you’re looking for an affordable, user-friendly tool with a wide range of integrations, Zoho Analytics may be a better fit.
Here is a detailed table comparing Power BI and Zoho Analytics:-
| Criteria | Power BI | Zoho Analytics |
|---|---|---|
| Ease of Use | Power BI has a steeper learning curve compared to Zoho Analytics. However, creating and customizing reports and dashboards can be easy once users are familiar with the interface. | Zoho Analytics has a user-friendly interface that makes it easy for users to create reports and dashboards without any coding knowledge. |
| Pricing | Power BI has a free version with limited features, and paid plans start at $9.99 per user per month. Higher-tier plans come with additional features, including collaboration tools and data connectors. | Zoho Analytics offers a free version with limited features, and paid plans start at $25 per month. Higher-tier plans come with more advanced features, including white labeling and the ability to embed reports in other applications. |
| Data Connectivity | Power BI offers a wide range of data connectors, including popular cloud services like Salesforce and Google Analytics, as well as on-premises data sources. | Zoho Analytics offers over 500 data connectors, including cloud services and on-premises data sources. |
| Data Modeling | Power BI has robust data modeling capabilities, allowing users to create relationships between tables, add calculated columns, and create hierarchies. | Zoho Analytics offers basic data modeling capabilities, including creating relationships between tables, but the functionality is more limited compared to Power BI. |
| Visualization | Power BI offers various visualization options, including charts, graphs, and maps. Users can also create custom visualizations using the Power BI Developer Center. | Zoho Analytics offers a range of visualization options, including charts, graphs, and tables. While the selection is more limited than Power BI, users can still create visually appealing reports and dashboards. |
| Collaboration | Power BI offers collaboration features, including sharing dashboards and reports with other users and publishing on the web. Users can also collaborate on reports in real-time using Power BI’s collaboration tools. | Zoho Analytics offers collaboration features, including sharing reports and dashboards with other users and allowing users to comment on reports. However, real-time collaboration features are more limited compared to Power BI. |
| Mobile App | Power BI offers a mobile app for iOS, Android, and Windows devices, allowing users to access their reports and dashboards on the go. | Zoho Analytics offers a mobile app for iOS and Android devices, allowing users to access their reports and dashboards on the go. |
| Customer Support | Power BI offers a range of customer support options, including a knowledge base, community forum, and support ticket system. Paid plans also come with dedicated support. | Zoho Analytics offers a knowledge base, community forum, and support ticket system. Paid plans also come with dedicated support. |
5. Oracle Analytics
Oracle Analytics is a two-in-one software. In addition to being a data automation tool, it is also a business intelligence tool.
It can function well in any organization as long as it is data-centric. The device skims through the entire organization’s databases to give the user valid real-time data values.
It is an on-command Power BI Alternative that has a wide range of features. Like other business intelligence tools, Oracle analytics provides users with easy-to-comprehend data reports that were once highly complex when gathered.
Depending on the user’s need, these reports can be created at regular intervals, like monthly, quarterly, or annually. The feature of mobile analytics allows the user to gain insights about data created by mobile platforms like applications or mobile websites.
This feature helps in increasing the database of the organization. Another helpful feature is transforming numerical data into visually pleasing charts for straightforward interpretation, even by a layperson.
Oracle Analytics provides information about opportunities and dangers for the organization. Getting access to such data at the right time is crucial for the organization to take action for its future.
The software also keeps up with the recent trends in the marketplace. Oracle Analytics is a professional tool that can carry out all the steps of the data analysis process.
The software guarantees a secure connection with the organization’s devices and maintains data privacy.

Power BI vs Oracle Analytics:-
If you are looking for an affordable and easy-to-use solution with strong integration capabilities, Power BI may be the better choice.
However, Oracle Analytics may be a better fit if data security is a top priority and you require more advanced analytics features and scalability.
Here’s a detailed comparison table between Power BI and Oracle Analytics:-
| Features | Power BI | Oracle Analytics |
|---|---|---|
| Data Sources | Power BI supports various data sources such as Excel spreadsheets, CSV files, SQL Server, Oracle, MySQL, PostgreSQL, and many more. | Oracle Analytics also supports various data sources such as Oracle databases, MS SQL Server, MySQL, PostgreSQL, and others. |
| Ease of Use | Power BI is known for its ease of use, user-friendly interface, and intuitive drag-and-drop visualizations that require minimal coding knowledge. | Oracle Analytics has a steeper learning curve and requires some coding knowledge. However, it provides a more customizable user experience. |
| Visualization | Power BI provides various visualization options, including bar charts, line charts, pie charts, maps, tables, and more. | Oracle Analytics also provides various visualization options, but the customization options are more advanced, making it a better fit for users with technical skills. |
| Data Modeling | Power BI provides a simplified data modeling experience that allows users to easily create relationships between tables and build data models. | Oracle Analytics provides a more advanced data modeling experience that enables users to create more complex data models with hierarchies, custom calculations, and more. |
| Collaboration | Power BI allows users to share reports and dashboards easily with others, collaborate with team members, and embed reports into other applications. | Oracle Analytics provides collaboration features such as sharing data sources and reports with other users and publishing reports to a shared platform. |
| Security | Power BI provides various security features, including data encryption, role-based access control, and integration with Azure Active Directory. | Oracle Analytics also provides data encryption and role-based access control but requires more technical expertise to set up and manage. |
| Pricing | Power BI offers various pricing plans, including a free version, a pro version for $9.99/user/month, and an enterprise version for $20/user/month. | Oracle Analytics pricing is based on a per-user model, starting at $1,500/year. It also requires an Oracle Cloud subscription, which can add to the cost. |
| Mobile App | Power BI provides a mobile app for iOS, Android, and Windows devices that allows users to access reports and dashboards on the go. | Oracle Analytics also provides a mobile app for iOS and Android devices that allows users to access reports and dashboards on the go. |
6. Reveal
Reveal is among the most famous Power BI alternatives. This business analytics tool can bring out the best of data in the light.
The software promotes efficient decision-making by analyzing large amounts of data and providing eye-catching reports. The users use this tool as an embedded analytics software that helps integrate systems, independent software, and vendors.
In the case of an already existing business intelligence software, Reveal can be merged with it to provide immediate results.
The business intelligence tool functions well with personal computers, Macs, and tablets. This multi-device support makes it convenient for the users to get hold of data at any point in time from any place.

The account holders of this software can create, modify, and give out the dashboards to other people through a secured connection.
This feature reduces the dependency factor on just one person and increases the smoothness of the workflow.
Reveal is compatible with SQL databases, spreadsheets, and other services provided by the cloud. The software integrates properly with Microsoft Excel, Google Sheets, Google Drive, Dropbox, and other tools.
Power BI vs Reveal:-
If you require a comprehensive BI tool with advanced features and integration with other Microsoft tools, Power BI may be the better option.
However, Reveal may be a good choice if you are looking for a simpler and more intuitive tool that offers unique visualization capabilities.
Here is a detailed table comparing Power BI and Reveal:-
| Feature | Power BI | Reveal |
|---|---|---|
| User Interface | Power BI has a modern and sleek interface with intuitive drag-and-drop functionality. | Reveal has a user-friendly and responsive interface that is easy to navigate. |
| Data Integration | Power BI allows integration with over 70 different data sources, including Excel, SharePoint, and Salesforce. | Reveal has a built-in data connector that enables integration with various data sources such as SQL, Oracle, and PostgreSQL. |
| Visualization | Power BI offers various visualization options, including charts, graphs, and maps. The visuals are highly customizable, and users can create custom visuals using Power BI developer tools. | Reveal provides stunning and highly interactive visualizations that are optimized for large datasets. It offers features such as heat maps, bubble charts, and treemaps. |
| Collaboration | Power BI allows users to share dashboards and reports with others and collaborate in real-time with team members. | Reveal allows users to share dashboards and reports with others and collaborate in real-time with team members. It also offers an embedded analytics feature that enables users to integrate analytics into their applications. |
| Pricing | Power BI offers a free version with limited functionality, and paid plans range from $9.99/user/month to $20/user/month. | Reveal offers a free trial and paid plans range from $20/user/month to $90/user/month. |
| Learning Curve | Power BI has a steeper learning curve, and users may need to spend some time learning the tool’s features and functionalities. | Reveal is relatively easy to learn and use, with intuitive drag-and-drop functionality. |
7. Looker
One of the top Power BI alternatives is Looker. Looker uses their very own SQL-based data representation language known as LookML.
The software focuses on finding data and then performing data analysis if required.
The user interface is web-based. Once LookML is attached to the organization’s database, it quickly understands how your business’s users work and provides a data model according to it.

The setup process is a bit complicated and has to be done by a designated data team. Once the software is set up and used, business users can ask queries about it when needed.
The excellent filtering function lets users get their hands on even the smallest details. Looker is a cloud-based software. The software gives access to real-time reports along with tailor-made, collective drag-and-drop dashboards.
Looker helps schedule and share reports and updates to the organization’s internal and external public through various channels, like email, links, Segment, Slack, etc. The dashboards provided by the tool can be attached to third-party websites and portals for gaining analytical insight into the same.
Looker integrates well with various other applications, making the work operations automated. The software ensures the protection of data through a single secured connection.
Looker provides customizable packages. The pricing then depends on the number of users and other details. Looker is best suitable for small to medium enterprises.
Various users can use the software at all levels of the organization. An experienced data team is necessary to bring out the best functions of the software.
There are a few downsides to using Looker. Compared to other alternatives, it is a bit heavy on the pocket. Due to the large amounts of data that must be processed, the speed of the software can become slow.
The data analysts must be trained for LookML, thereby incurring training costs.
Power BI vs Looker:-
Power BI may be the better option if you’re looking for a more user-friendly tool with a lower cost. However, if you need advanced data modeling capabilities and customizability, Looker may be the better choice.
Here’s a detailed table comparing Power BI and Looker:-
| Criteria | Power BI | Looker |
|---|---|---|
| Cost | Power BI is available as a subscription-based service with several pricing tiers. The cost ranges from $9.99 per user per month for Power BI Desktop to $4,995 for Power BI Premium. | Looker’s pricing is based on the number of users and data volume. No public pricing information is available, but customers have reported that Looker is generally more expensive than Power BI. |
| Data Sources | Power BI can connect to various data sources, including Excel spreadsheets, SQL databases, and cloud-based sources. | Looker has a similar range of data source connectors as Power BI, but it is known for its strong integration with Google BigQuery. |
| Data Modeling | Power BI’s data modeling features allow users to create relationships between tables, define hierarchies, and create calculated columns and measures. | Looker’s data modeling features allow users to create and manage their own data models, including a robust set of data transformation tools. |
| Visualization | Power BI includes various data visualization options, including bar charts, line charts, scatter plots, and maps. Users can also create custom visualizations using the Power BI developer tools. | Looker includes various data visualization options, including bar charts, line charts, scatter plots, and maps. Looker also allows users to create custom visualizations using Looker’s visualization API. |
| Collaboration | Power BI includes collaboration features such as data, dashboard, and report sharing. It also integrates with other Microsoft collaboration tools like Teams and SharePoint. | Looker’s collaboration features include sharing dashboards and reports, scheduling data deliveries, and collaborating with team members in real-time. |
| Security | Power BI includes various security features, including role-based access control, data encryption, and data loss prevention. It also meets several industry-specific compliance standards. | Looker has a similar range of security features as Power BI, including role-based access control, data encryption, and compliance with industry-specific standards. |
| Ease of Use | Power BI has a user-friendly interface and a drag-and-drop dashboard designer, allowing users to create dashboards quickly and easily. | Looker has a steeper learning curve than Power BI but offers more customization options and advanced data modeling features. |
| Customer Support | Power BI offers a range of customer support options, including community forums, documentation, and phone and email support. | Looker offers customer support through various channels, including a customer support portal, email, and phone support. |
| Integrations | Power BI integrates with various third-party applications, including Salesforce, Google Analytics, and Marketo. | Looker also integrates with various third-party applications, including Salesforce, Google Analytics, and Slack. |
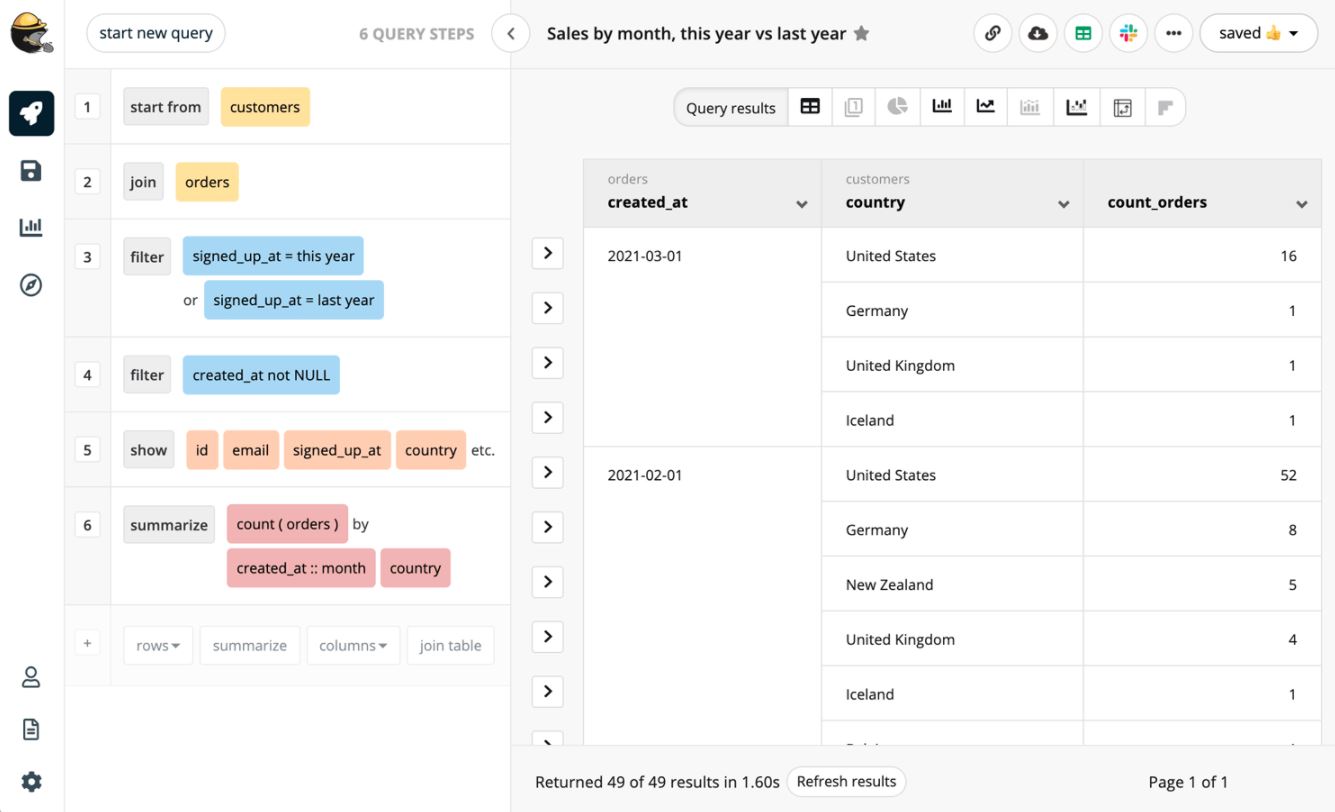
8. Trevor.io
Trevor.io is an uncomplicated data analytics tool suitable for usage by any person. The setting-up process is simple, and it has a variety of features.
The no-code Query builder enables users to ask questions when a problem arises. The user interface is interactive and showcases dashboards and reports.
There is no limit on the number of dashboards created; helpful using the data filter and customization integrant. The database linked to the software keeps getting updated automatically.
The easy installation saves time, and the user can explore data quickly. URLs, emails, Slack, or other apps are used for sharing reports and dashboards created by Trevor.io.
This software best suits SaaS-based startups as it promotes secure connections to SQL databases and data warehouses. Even non-tech users can quickly get hold of this software due to its powerful no-code Query Builder.
The data from various sources can easily be combined in a few smooth steps. The database schema creates visual reports occasionally and is updated regularly.
Trevor.io provides unlimited access to personally tailored reports and interactive dashboards with aesthetically pleasing visuals. The software combines with apps like Salesforce to ensure a smooth programmed workflow.
The Pro version consists of a connection to your first database. There is no limit on the number of users and dashboards.
This version can be obtained by paying $299 every month. The users can take a fourteen-day free trial to ensure it is the right fit.
The business version gives more database types at $499 per month. A free fourteen-day trial is available with this version as well.
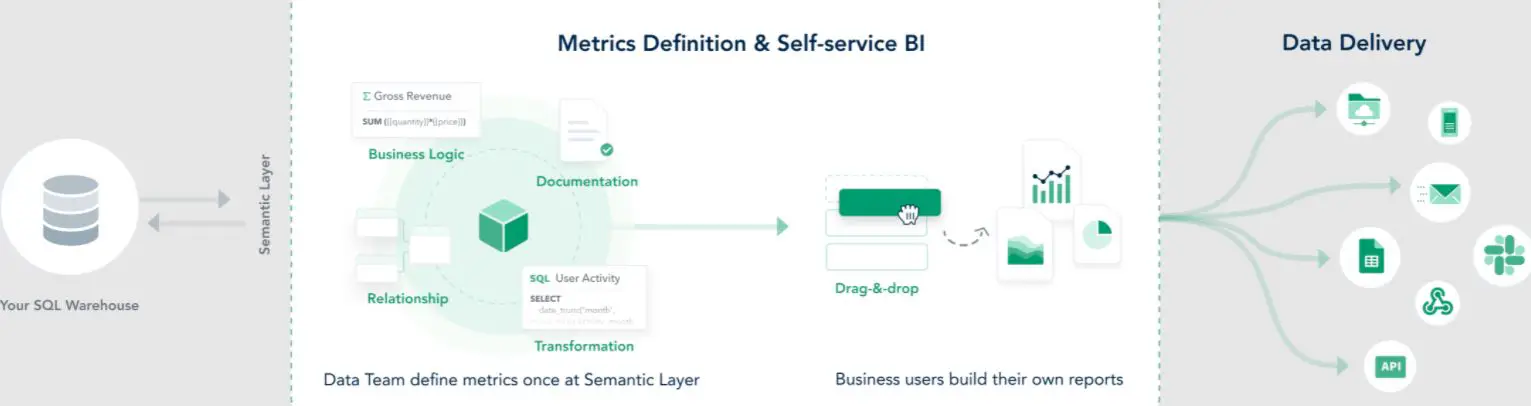
9. Holistics
Another powerful cloud-based Power BI alternatives is Holistics. The software assists data teams in creating efficient models which can answer business-related queries without SQL.
The simple drag-and-drop user interface provides a quick solution and creates charts rapidly. For advanced analytics functions, Holistics supports SQL.
The filters segregate data finely to avoid leaving any important detail behind. The customized dashboards can be saved on the user’s smartphone as shortcuts to have direct access in case of urgent requirements.
These tailored dashboards can be easily shown to customers, partners, or stakeholders.
Holistics also provides the option to schedule updates and distribute reports and dashboards through google sheets, URLs, PDFs, emails, and Slack. Holistics connects to the user’s SQL database.
The established connection is secured, and no organizational data is stored on this software. Customer support provides quick solutions through emails. However, they can take longer to respond, depending on the complexity of the problem.
Holistics has various versions; 10 users can access the Entry version at once by paying $ 120 monthly. Twenty users can access the standard version for $300 every month.
It comprises PDF reports, graphical map illustrations, and metric sheets. The Professional version provides unlimited reports at the expense of $600 every month.
Lastly, there is also an option for a need-specific package that can be designed according to the needs of the enterprises.
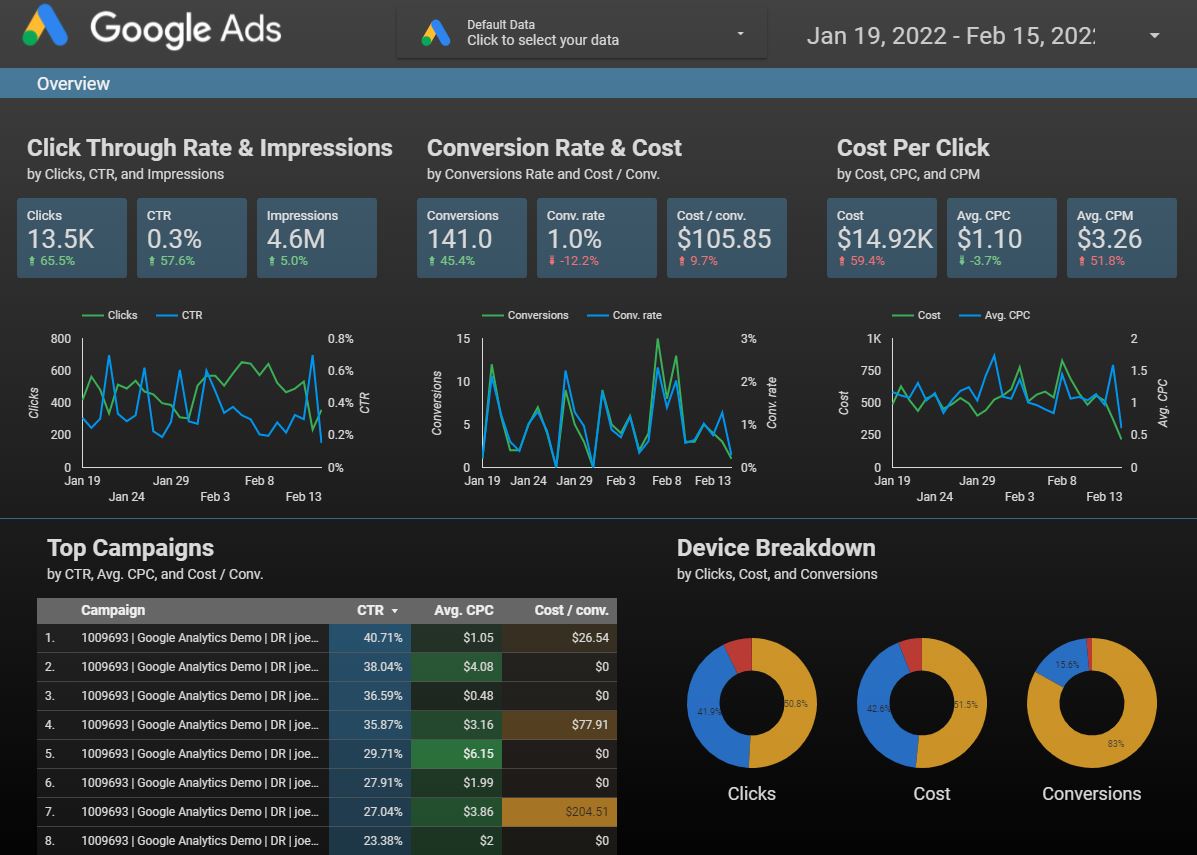
10. Google Data Studio
Just as Power BI is a tool by Microsoft, Data Studio is a tool introduced by Google. Data Studio is a cloud-based tool segment of its marketing platform Google.
The software works well with GA360 devices as well. It is a free tool that helps transform unfiltered, hard-to-understand data into tailored reports and dashboards.
The key points differentiating this software from other alternatives are its built-in features like data connectors, visually pleasing reports, accurate data visualization, and spontaneous dashboards.
All of these features help enterprises in better decision-making. Custom formulae allow the invention of metrics and dimensions to convert data into understandable values.
Data Studio provides a range of report templates that can be customized according to the user’s needs to save time.
Their unique comparison functions assist in keeping tabs on the changes in data over time.
The software functions well with other tools from Google, like Google Analytics, Google Ads, MySQL, YouTube, Facebook Ads, etc.
Data Studio can provide the solution without any code or SQL Explorer when a question arises. The reports created by the software can be distributed without any restrictions to the internal and external public.
The support system provides instant solutions to any queries related to the software. There are not many versions of this software. Google account holders can access the Data Studio for free.
The software is best cut out for users whose focus is tracking and analyzing website traffic, ads, social media, and digital marketing campaigns.
Organizations from the category of small to medium-sized and those who do not have the funds to invest in a heavy business intelligence tool can use this software to satisfy their needs.
Apart from all these exciting features, there are a few drawbacks. There is a limit to graphical representations and complicated analytics compared to proper business intelligence tools.
A person inexperienced in advanced data-related operations cannot use this software. Hence employee training is necessary. Lastly, but an important one is that Google Data Studio does not work with Excel.
Power bi vs Google data studio:-
Power BI is a more powerful tool with advanced analytics capabilities and data modeling features, while Google Data Studio is a simpler tool focusing on data visualization and collaboration.
Power BI might be a better choice if you are looking for a tool for advanced data analytics. If you need a tool that is easy to use and collaborate with others, Google Data Studio might be a better fit.
here is a comparison table on Power BI vs Google Data Studio:-
| Feature | Power BI | Google Data Studio |
|---|---|---|
| Data Sources | Supports over 120 data sources, including cloud-based services | Supports a limited number of data sources |
| Data Visualization | Offers a wide range of visualizations with customizations | Offers limited visualizations with less customizations |
| Performance | Has fast performance and processing speed | Can be slow when working with large datasets |
| Collaboration | Offers collaboration through Office 365 and SharePoint | Offers collaboration with Google Workspace |
| Cost | Requires a subscription, with a free trial available | Offers a free version with limited features |
| Learning Curve | Requires some technical knowledge to use effectively | Easy to use and requires minimal technical knowledge |
| Mobile Support | Offers mobile app support for iOS and Android devices | Offers mobile app support for iOS and Android devices |
| Community Support | Has a large and active community of users and developers | Has a growing community of users and developers |
| Security | Offers enterprise-level security and compliance features | Offers enterprise-level security and compliance features |
11. Ubiq
A cloud-based business intelligence software allows individuals to explore data without prerequisite coding or SQL knowledge. The easy-to-understand user interface has a drag-and-drop mechanism.
Ubiq has over twenty-four pictural designs for making customized charts and dashboards. Ubiq allows its users to interpret data from multiple sources.
The peculiar filtering function of this software can bring out even the tiniest details to light.
The reports can be made anytime without much hassle. Ubiq prefers SQL if any user requires advanced-level data analytics for their organization.
The software allows the export and distribution of reports through emails in various formats like PDF, CSV, or JPEG. Regular updates, either weekly or monthly, can also be scheduled with the help of this software.
The process of starting up with this software is straightforward. The user only needs to sign up and gain a basic understanding of the account. Ubiq can be operated online from devices like Macs, mobiles, tablets, and personal computers.
The software is compatible with many other computer languages, like MySQL, PostgreSQL, SQL Server databases, AWS, Azure, and Redshift.
The Ubiq software policies take data privacy very seriously. The software functions only on a secure connection and gives read-only access to other people who try to access the shared data. Ubiq doesn’t store the data saved by the organization.
There are different packages curated based on the number of users and dashboards. The individual package starts at $29 per month, with access to only one dashboard. As its name suggests, one user can only access it at a time.
A $299 per month package allows twenty users to use the software simultaneously for an organization with a large team. It gives access to around sixty dashboards. The option of customized pricing is also at hand.
Ubiq is majorly suitable for startups and other small to medium enterprises that do not have a large team. If their primary purpose is to convert complex data into an uncomplicated visual form of data, then, Ubiq is the right fit.
For users that do not want to invest much into perplexing business intelligence software, Ubiq would be the best solution.
However, Ubiq would not be fruitful if the size of the organization’s team increases. At least some technical know-how is required to get the best out of this software.
The software has to be constantly refreshed to get modified reports.

12. Metabase – Open Source Power BI alternatives
Metabase is an open-source software suitable for experienced and intermediate technical users who can use the query builder option, which needs expertise in SQL.
The software can be used within the organization or in the cloud, which non-tech users can access.

Metabase assists the users in combining filters, joins, aggregations, and variables with SQL or the Notebook Editor.
It provides a range of graphics and valuable recommendations for creating intuitive dashboards. The software allows the scheduling and sharing of reports through email and Slack by providing a unique link.
Various SQL and NoSQL databases can be connected with the help of this software. Metabase focuses primarily on organizations as its customers.
It provides quick support for premium customers. For regular customers, three days are given for email support.
The open-source software that is self-hosted doesn’t need to be purchased. It has over twenty databases and unrestricted access to charts and dashboards. However, the free version does not have the option for automatic upgrades and backups.
Another version named “Cloud Starter” is a paid version. The user has to pay $85 per month. Five different users can use the account at once.
A free fourteen-day trial is given to the users. For any more users to use the account, an additional $5 has to be paid.
The Cloud Growth version can be obtained by paying $749 every month. Ten users can use the account at once. For any more person to become a user of this account, $15 has to be paid. This version also has a free fourteen-day trial.
The enterprise version has an annual plan, wherein the user has to pay $15 thousand. The users have the choice to either keep the software cloud-based or self-hosted. This version comes with a thirty-day free trial period.
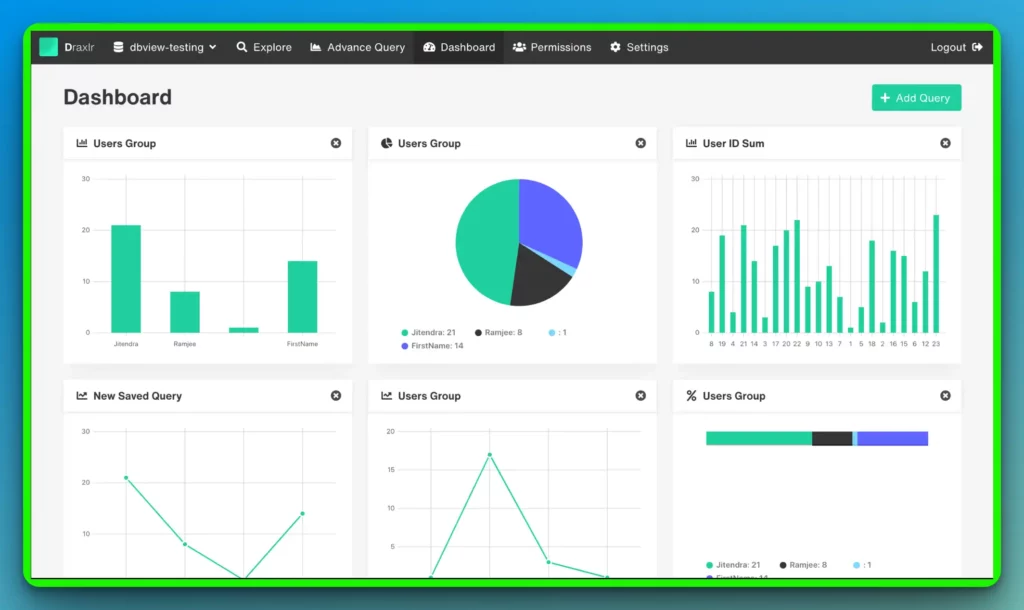
13. Draxlr
Draxlr is a simplified analytics and monitoring tool. It helps you build a dashboard and set up Slack and email alerts on your data. You can achieve this with or even without writing code.
Draxlr provides an interactive and easy-to-use Query builder that lets you explore your data and get your desired answers.
Once you have found the results you were looking for, you can add them to a Dashboard. You can also visualize your data in Graphs and Charts. Draxlr also lets you export your data in CSV and Excel formats.
Draxlr is a collaborative tool, i.e.; you can invite people to your Workspace to build and view dashboards. Along with that Draxlr also lets you share your insights in multiple ways.
You can share your dashboards as Public URLs PIN Protected URLs, or you can embed them on your website and apps; not just that, you can also make API calls to get insights from Draxlr to your Apps.
Draxlr also lets you monitor your data to stay on top of your insights. You can set up Slack and Email alerts with Draxlr. The alerts can be set periodically or timely basis.
You can also set threshold-based Alerts. So that when your data hits a certain value, you will be alerted via Slack, Email, or both.
Overall, Draxlr makes the process very simple and easy. And best of all, it is one of the most affordable options.

Power BI vs Excel
Excel may be the better choice if you need to work with small datasets and do basic data analysis. However, if you are working with large datasets or need to create complex visualizations and reports, Power BI is likely the better choice.
here’s a table comparing Power BI and Excel:-
| Power BI | Excel |
|---|---|
| Designed for data analysis and visualization, with advanced data modeling and reporting capabilities. | Designed for spreadsheet calculations and analysis, with basic charting and reporting features. |
| Can handle large amounts of data and complex calculations, with the ability to import data from various sources. | Limited to a certain amount of data and calculation complexity, with data import capabilities limited to certain file types. |
| Offers interactive dashboards and visualizations, with the ability to drill down into specific data points. | Offers basic charting and visualization features, with limited interactivity. |
| It can create relationships between different data sources, allowing for more comprehensive analysis. | Limited in its ability to handle multiple data sources and relationships between them. |
| It requires a separate license and is more expensive than Excel. | Included in most Microsoft Office suites and is a more cost-effective option. |
| More suitable for business intelligence and data analysis professionals. | Suitable for a wide range of users, from individuals to businesses of all sizes. |
Power bi vs Power bi pro
While both versions of Power BI offer basic data visualization and analysis capabilities, Power BI Pro provides more advanced features and capabilities for business users who need to collaborate with others, share reports, and access more data sources.
here’s a comparison table between Power BI and Power BI Pro:-
| Feature | Power BI | Power BI Pro |
|---|---|---|
| Data capacity | Up to 1 GB per user | Up to 100 GB per user |
| Collaboration | Share dashboards and reports with others, but only with view or edit permissions | Share dashboards and reports with others with view, edit, or collaborate permissions |
| Data refresh | Manual data refresh | Automatic and scheduled data refresh |
| Data sources | Connect to over 100 data sources | Connect to over 120 data sources |
| Power BI mobile app | Available for iOS, Android, Windows | Available for iOS, Android, and Windows devices |
| Cost | Free | $9.99 per user/month |
Power bi vs Power bi Desktop
Power BI is a cloud-based service that provides a complete end-to-end solution for data analysis. In contrast, Power BI Desktop is a local application for creating reports and visualizations, which can later be published to the Power BI service.
here’s a table outlining the differences between Power BI and Power BI Desktop:-
| Feature | Power BI | Power BI Desktop |
|---|---|---|
| Pricing | Power BI is available as both a free and paid service. | Power BI Desktop is a one-time purchase or available through a Power BI Pro subscription. |
| Deployment | Power BI is a cloud-based service. | Power BI Desktop is a desktop application. |
| Connectivity | Power BI can connect to a wide variety of data sources. | Power BI Desktop can connect to the same data sources as Power BI and additional sources that require an on-premises gateway. |
| Data Modeling | Power BI provides basic data modeling capabilities. | Power BI Desktop provides more advanced data modeling capabilities, including creating relationships between tables and adding calculated columns and measures. |
| Report Creation | Power BI allows for the creation of interactive reports. | Power BI Desktop allows for the creation of more complex and customizable reports, including the use of custom visuals and custom themes. |
| Collaboration | Power BI allows for collaboration through shared workspaces. | Power BI Desktop allows for collaboration through shared PBIX files or by publishing reports to Power BI. |
| Integration | Power BI integrates with other Microsoft products like Excel, SharePoint, and Teams. | Power BI Desktop integrates with other Microsoft products and third-party tools such as R and Python. |
| Mobility | Power BI offers mobile apps for iOS, Android, and Windows devices. | Power BI Desktop reports can be viewed through the Power BI mobile app on mobile devices. |
| Limitations | Power BI has some limitations in terms of data processing and storage. | Power BI Desktop has fewer data processing and storage limitations but requires more powerful hardware to run efficiently. |
| User Interface | Power BI has a web-based user interface that is easy to use. | Power BI Desktop has a more complex user interface that requires some learning to use effectively. |
Power bi vs Cognos
Power BI is a more user-friendly and flexible tool for small to medium-sized businesses. At the same time, Cognos is a more advanced and scalable tool that is designed for larger enterprises with complex data needs.
here is a comparison table on Power BI and Cognos:-
| Feature | Power BI | Cognos |
|---|---|---|
| Company | Microsoft | IBM |
| License Model | Per User, Per Capacity | Per User, Per Capacity |
| Deployment Options | Cloud (Power BI Service), On-Premises (Power BI Report Server) | Cloud (Cognos Analytics), On-Premises (Cognos Analytics) |
| Data Connectivity | Supports over 90+ data sources | Supports multiple data sources (including Big Data, ERP systems) |
| Data Transformation | Powerful ETL capabilities through Power Query | Supports ETL capabilities through Data Manager |
| Visualization | Intuitive and visually appealing dashboards and reports | Highly customizable dashboards and reports |
| Natural Language Query | Supports Q&A feature for natural language queries | Offers natural language queries through Cognos Analytics |
| Mobile Support | Offers mobile app for iOS, Android, and Windows devices | Offers mobile support through Cognos Analytics mobile app |
| Integration | Integrates well with other Microsoft products and services | Integrates well with other IBM products and services |
| Pricing | Offers a range of pricing options for different needs | Offers flexible pricing options for different needs |
Power bi vs Domo
Power BI may be the better choice if you are already heavily invested in the Microsoft ecosystem or need strong data modeling capabilities.
If you need a broader range of features and are willing to pay a higher price for them, Domo may be a better fit.
here’s a comparison table on Power BI vs Domo:-
| Features | Power BI | Domo |
|---|---|---|
| Pricing | Lower cost with a free version and reasonable paid plans | Higher cost with a custom pricing structure |
| User Interface | Easy to use and intuitive with a familiar Microsoft Office look and feel | Modern and sleek interface with a customizable dashboard |
| Data Connectivity | Offers over 100 data connectors with easy data integration with Microsoft products | Connects with multiple data sources with a powerful data integration platform |
| Visualization | Wide range of customizable and interactive visualization options | Limited customization options but offers pre-built dashboard templates |
| Collaboration | Offers sharing and collaboration features with Microsoft Teams and SharePoint | Provides collaboration features with project sharing and messaging |
| Data Security | Offers advanced security features with Microsoft Azure and complies with various data security regulations | Provides secure data access and permissions with encryption and SOC 2 compliance |
| Customer Support | Offers online community support, user forums, and comprehensive documentation | Provides dedicated customer support and training services |
Power bi vs Grafana
Power BI is a more comprehensive and feature-rich tool for business intelligence and data analysis. At the same time, Grafana is a more specialized tool for real-time monitoring and visualization of metrics.
here’s a table comparing Power BI and Grafana:-
| Feature | Power BI | Grafana |
|---|---|---|
| Data sources | Power BI supports many data sources, including Excel files, SQL Server, Oracle, MySQL, Postgres, etc. | Grafana supports a variety of data sources, including Graphite, Elasticsearch, Prometheus, InfluxDB, MySQL, Postgres, and others. |
| Visualization | Power BI has a robust visualization option, including charts, tables, maps, etc. Users can create custom visualizations using the Power BI developer tools. | Grafana provides various visualization options, including charts, gauges, and heat maps. Users can create custom visualizations using the Grafana plugin framework. |
| Dashboard creation | Power BI provides a user-friendly interface for creating dashboards. Users can drag and drop visualizations onto the canvas and customize the layout. | Grafana provides a similar drag and drop interface for creating dashboards. Users can also import pre-built dashboards from the Grafana community. |
| Collaboration | Power BI allows users to collaborate on dashboards and reports with other Power BI users. Users can share reports and dashboards with specific individuals or groups, and set permissions for editing and viewing. | Grafana has limited collaboration features, although users can share dashboards and visualizations with others. |
| Mobile support | Power BI’s mobile app allows users to view and interact with dashboards and reports on the go. The app is available for iOS, Android, and Windows devices. | Grafana also has a mobile app that allows users to view and interact with dashboards on the go. The app is available for iOS and Android devices. |
| Pricing | Power BI has a free version with limited features and paid plans offering more functionality. Pricing starts at $9.99 per user per month. | Grafana has a free version with limited features, as well as paid plans that offer more functionality. Pricing starts at $49 per user per month. |
Power bi vs Tableau vs Python
Power BI and Tableau are great options if you’re looking for tools that are easy to use and offer a lot of pre-built functionality for creating interactive dashboards and reports.
Python is a good choice if you need more customization and flexibility in your data analysis and are comfortable with programming.
here’s a table comparing Power BI, Tableau, and Python:-
| Feature | Power BI | Tableau | Python |
|---|---|---|---|
| Data Visualization | Good | Excellent | Requires coding |
| Ease of Use | Good | Excellent | Requires coding |
| Data Importing | Good | Excellent | Requires coding |
| Cost | Affordable | Expensive | Free (open-source) |
| Customization | Limited | Good | Infinite |
| Data Modeling | Good | Limited | Excellent |
| Collaboration | Good | Good | Requires additional tools |
| Advanced Analytics | Limited | Good | Excellent |
| Integration with Other Tools | Limited | Good | Excellent |
Power bi vs Kibana
Power BI is a more general-purpose business intelligence tool that is easy to use and integrates well with other Microsoft products.
Kibana, on the other hand, is a specialized tool designed specifically for analyzing log data and requires more technical expertise to use effectively.
here’s a comparison table between Power BI and Kibana:-
| Feature | Power BI | Kibana |
|---|---|---|
| Platform | Desktop application and cloud service | Web-based application |
| Visualization | Offers a variety of visualizations | Offers a variety of visualizations |
| Data sources | Connects to various data sources | Primarily used with Elasticsearch |
| Data preparation | Provides data modeling and transformation tools | Limited data preparation capabilities |
| Real-time data | Supports real-time data streaming | Built for handling real-time data |
| User interface | User-friendly interface with drag-and-drop tools | Intuitive interface with a learning curve |
| Pricing | Offers both free and paid versions | Offers both free and paid versions |
| Customization | Customizable dashboards and reports | Customizable dashboards and reports |
| Security | Provides role-based security | Provides role-based security and encryption |
| Integration | Integrates with other Microsoft products | Integrates with other Elasticsearch and Elastic Stack |
| Support | Offers comprehensive support options | Offers community support and paid support subscription |
Power bi vs Power automate
Power BI primarily focuses on data analysis and visualization, while Power Automate is designed to automate workflows and business processes.
Both products can create end-to-end solutions that automate data collection, transformation, analysis, and reporting.
here’s a comparison table between Power BI and Power Automate:-
| Feature | Power BI | Power Automate |
|---|---|---|
| Purpose | Business analytics and data visualization | Workflow automation and process automation |
| Data Sources | Connects to various data sources including databases, Excel files, cloud-based services, etc. | Connects to various apps and services including Microsoft 365, Dynamics 365, SharePoint, Salesforce, etc. |
| Data Analysis | Provides interactive and real-time data analysis, visualization, and reporting capabilities | Does not provide data analysis, but can trigger automated workflows based on data changes |
| User Interface | Provides a rich and interactive user interface for data exploration and visualization | Provides a drag-and-drop visual workflow designer for building automation workflows |
| Collaboration | Provides collaboration features for sharing and collaborating on reports and dashboards | Provides collaboration features for sharing and collaborating on workflows and automations |
| Licensing | Offers various licensing options including Power BI Free, Power BI Pro, and Power BI Premium | Offers various licensing options including Power Automate Free, Power Automate per user, and Power Automate per flow |
Power bi vs Access
Power BI is a more powerful and flexible tool for data analysis, reporting, and visualization, while Access is primarily designed for storing and managing data.
However, Access can still be useful for small-scale data management and analysis, particularly for users already familiar with Microsoft Office tools.
here’s a table comparing Power BI and Access:-
| Feature | Power BI | Access |
|---|---|---|
| Data Visualization | Strong data visualization capabilities, including interactive dashboards and reports | Limited data visualization capabilities |
| Data Analysis | Advanced data analysis capabilities, including machine learning and AI integration | Basic data analysis capabilities |
| Data Storage | Requires external data storage, such as cloud services or on-premises databases | Can store data within the Access application |
| User Interface | User-friendly interface for creating and managing reports and dashboards | User interface can be complex and difficult to navigate |
| Collaboration | Allows for easy collaboration and sharing of reports and dashboards with others | Collaboration can be difficult, especially with large teams |
| Customization | Highly customizable with the ability to integrate with other applications and services | Limited customization options |
| Pricing | Offers both free and paid plans, with pricing based on features and usage | Included in Microsoft Office suite or available for purchase as a standalone product |
Power BI vs Alteryx
Power BI is best suited for creating visually appealing and interactive reports and dashboards, while Alteryx is ideal for data preparation, blending, and advanced analytics. Many businesses use both tools together to create comprehensive business intelligence solutions.
Here’s a comparison table of Power BI and Alteryx:-
| Features | Power BI | Alteryx |
|---|---|---|
| Data Preparation | Limited Data Preparation Capabilities, requires external tools | Advanced Data Preparation Capabilities with built-in data profiling, cleansing, transformation, and integration tools |
| Data Analysis | Basic Data Analysis Capabilities with limited statistical functions | Advanced Data Analysis Capabilities with built-in predictive and spatial analytics tools |
| Visualization | Advanced Visualization Capabilities with drag-and-drop interface | Limited Visualization Capabilities, requires external tools |
| ETL (Extract, Transform, Load) | Limited ETL Capabilities with basic data loading and transformation functions | Advanced ETL Capabilities with built-in data integration and transformation tools |
| Collaboration | Collaborate with others through shared workspaces, comments, and annotations | Collaborate with others through shared workflows, annotations, and version control |
| Pricing | Starts at $9.99 per user per month for Power BI Pro and $4,995 per user per year for Power BI Premium | Starts at $5,195 per user per year for Alteryx Designer and $1,495 per user per year for Alteryx Server |
Power bi vs Excel vs Tableau
Power BI is a good choice for small to medium-sized businesses that need basic data analysis and reporting capabilities. Excel is a versatile tool suitable for various tasks, from simple calculations to complex modeling.
Tableau is a powerful data visualization tool best suited for data professionals and large enterprises needing advanced features and customization options.
here’s a table comparing Power BI, Excel, and Tableau:-
| Feature | Power BI | Excel | Tableau |
|---|---|---|---|
| Data Visualization | Yes | Yes | Yes |
| Data Modeling | Yes | Yes | Yes |
| Data Analysis | Yes | Yes | Yes |
| Collaboration | Yes (with Power BI service or SharePoint) | Yes (with SharePoint or OneDrive) | Yes (with Tableau Server or Online) |
| Cloud Support | Yes (with Power BI service or Azure) | Yes (with OneDrive or SharePoint Online) | Yes (with Tableau Server or Online) |
| Ease of Use | Easy for non-technical users and intermediate users | Easy for basic users, intermediate and advanced | Easy for basic and intermediate users, advanced |
| Data Sources | Multiple data sources are available | Excel sheets, databases, external data sources | Multiple data sources are available |
| Price | Free version available, paid plans start at $9.99/month | Part of Microsoft 365 subscription, paid plans | Paid plans start at $35/user/month |
| Customer Support | Online community, email support, phone support | Online community, email support, phone support | Online community, email support, phone support |
Pros and Cons of using Power BI
Here’s a table outlining some of the pros and cons of using Power BI:-
| Pros | Cons |
|---|---|
| Powerful data analysis capabilities: Power BI provides users with a robust set of data analysis tools, allowing them to create insightful and interactive visualizations that can be customized to fit their needs. | Steep learning curve: While Power BI is a powerful tool, it can take time to learn how to use it effectively, especially for users unfamiliar with data analytics. |
| Easy integration with other Microsoft products: Power BI integrates seamlessly with other Microsoft products, such as Excel and SharePoint, making it easy for users to access and analyze data from various sources. | Limited customization options: While Power BI offers a wide range of customization options, some users may be limited in what they can do with the tool. |
| A cloud-based platform: Power BI is a cloud-based platform, meaning that users can access their data and dashboards from anywhere, as long as they have an internet connection. | Limited offline capabilities: While Power BI is a cloud-based platform, it does have some limited offline capabilities. However, users must download the data and dashboards beforehand to access them offline. |
| Intuitive drag-and-drop interface: Power BI’s drag-and-drop interface makes it easy for users to create custom visualizations and dashboards without knowing how to code. | Cost: While Power BI offers a free version, users who need more advanced features or require more storage will need to pay for a premium subscription. |
| Strong community support: Power BI has a large and active community of users who share tips, tricks, and best practices, making it easy for new users to get started and for experienced users to learn new skills. | Limited data modeling capabilities: While Power BI does offer some data modeling capabilities, users may find that they are limited in terms of what they can do with the tool. |
📗FAQ’s
Is Power BI easier than Tableau?
It depends on the user’s familiarity with the software and specific needs. Some users find Power BI more user-friendly and easier to navigate, while others prefer Tableau’s more robust features and flexibility.
What is the main difference between Power BI and Tableau?
One of the main differences between Power BI and Tableau is that Power BI is a Microsoft product and therefore integrates seamlessly with other Microsoft tools like Excel and SharePoint. Tableau is a standalone software that offers more advanced data visualization capabilities and flexibility.
Which feature of Tableau is not there in Power BI?
Tableau has several features unavailable in Power BI, including more advanced visualization options, the ability to blend data from multiple sources, and more robust data modeling capabilities.
How long will it take to learn Tableau?
The time it takes to learn Tableau depends on the user’s prior experience with data analysis and visualization tools. With dedicated effort and practice, many users can become proficient in Tableau within a few weeks or months.
Does Tableau require coding?
Tableau does not require coding, although a basic understanding of data structures and SQL can be helpful for more complex analyses.
Does Tableau use SQL?
Tableau uses SQL for data querying and manipulation.
Is Tableau better than Excel?
Tableau and Excel serve different purposes and have different strengths. Tableau is more powerful for visualizing large, complex data sets, while Excel is better for managing and manipulating smaller data sets.
Why is Tableau preferred?
Tableau is preferred for its powerful data visualization capabilities, intuitive user interface, and ability to handle large and complex data sets.
What are the pros and cons of Tableau?
Pros of Tableau include powerful data visualization capabilities, user-friendly interface, and ability to handle large data sets. Cons include high cost, limited collaboration capabilities, and potential performance issues with very large data sets.
Can I get a job by just learning Tableau?
Proficiency in Tableau can be valuable for many data-related jobs, but other skills like data analysis and programming may also be required for some positions.
Can I learn Tableau without knowing Excel?
Basic knowledge of Excel can be helpful, but it is not strictly necessary to learn Tableau.
Can Tableau be self-taught?
Yes, Tableau can be self-taught through online tutorials, courses, and practice with sample data sets.
Do I need SQL to learn Tableau?
A basic understanding of SQL can be helpful for more complex analyses in Tableau, but it is not strictly necessary for basic visualization and data analysis.
What should I learn before Tableau?
Before learning Tableau, basic knowledge of data structures, statistics, and data analysis can be helpful.
What skill is required with Tableau?
Data visualization, analysis, and critical thinking skills are important for working with Tableau.
Does Tableau use Python?
Tableau can interface with Python for more advanced analyses, but it is not strictly necessary for basic visualization and analysis.
Which language is used in Tableau?
Tableau uses its proprietary language for data manipulation and visualization.
Is Tableau easier than SQL?
Tableau is designed to be more user-friendly and intuitive than SQL, although a basic understanding of SQL can be helpful for more complex analyses in Tableau.
Is Tableau still in demand?
Yes, Tableau is still in demand for its powerful data visualization capabilities and ability to handle large and complex data sets.
What is the salary of Tableau Excel?
The salary of Tableau professionals varies depending on the job title, level of experience, and location, but average ranges from $75,000 to $120,000 per year.
Will Tableau replace Excel?
Tableau and Excel serve different purposes and have different strengths, so it is unlikely that Tableau will completely replace Excel. However, Tableau can be a valuable complement to Excel for more advanced data visualization and analysis.
Why is Tableau difficult?
Tableau can be difficult for users unfamiliar with data visualization and analysis tools or with limited experience with complex data sets.
Why not to use Tableau?
Tableau may not be the best fit for users who do not need advanced data visualization or who do not have the budget for the software.
What is Tableau not good for?
Tableau may not be the best fit for users needing real-time data processing, large data sets, or complex machine learning algorithms.
What are the biggest complaints with Tableau?
Some common complaints about Tableau include high cost, limited collaboration capabilities, and potential performance issues with very large data sets.
What is the hardest part about Tableau?
The hardest part about Tableau for many users is the learning curve, especially for users unfamiliar with data visualization and analysis tools.
Do many companies use Tableau?
Many companies, including Fortune 500 companies and government agencies, use Tableau for data visualization and analysis.
Is Power BI better than Python?
Power BI and Python have different purposes and strengths, so it isn’t easy to compare them directly. Power BI focuses more on data visualization and analysis, while Python is a general-purpose programming language with many applications.
Which is better, Tableau or Python?
Tableau and Python have different purposes and strengths, so the better choice depends on the user’s specific needs. Tableau is better for data visualization and analysis, while Python is better for more general-purpose programming tasks.
Is Python useful with Power BI?
Python can be useful for more advanced data analysis and manipulation within Power BI, especially for more complex analyses.
Can Power BI replace Python?
Power BI and Python have different purposes and strengths, so it is unlikely that Power BI will completely replace Python.
What is the Python equivalent of Tableau?
Python has several data visualization and analysis libraries, including Matplotlib, Seaborn, and Plotly.
Why Python instead of Tableau?
Python is more flexible and can be used for a wider range of programming tasks, while Tableau is better for data visualization and analysis.
Can Python replace Tableau?
Python can complement Tableau for more advanced data analysis and manipulation, but it is not a complete replacement for Tableau’s data visualization capabilities.
Is Python useful for Tableau?
Python can be useful for more advanced data analysis and manipulation within Tableau, especially for more complex analyses.
How long does it take to learn Python?
The time it takes to learn Python depends on the user’s prior experience with programming languages and their specific learning style. Still, many users can become proficient in Python within a few months.
Can we create a dashboard in Python?
Yes, Python has several libraries for creating interactive data dashboards, including Plotly and Dash.
Is Tableau SQL or Python?
Tableau uses its proprietary language for data manipulation and visualization but can interface with SQL and Python for more advanced analyses.
Can you write code in Tableau?
Tableau uses its proprietary language for data manipulation and visualization but can interface with SQL and Python for more advanced analyses.
Why is Python preferred over Excel?
Python is more flexible and can be used for a wider range of programming tasks, while Excel is better for managing and manipulating smaller data sets.
Which language is best for Tableau?
Tableau uses its proprietary language for data manipulation and visualization but can interface with SQL and Python for more advanced analyses. Depending on the user’s needs, SQL, Python, or R proficiency may help work with Tableau.
Does Tableau use R or Python?
Tableau can interface with R and Python for more advanced data analysis and manipulation.
Is there a future for Tableau?
Yes, Tableau has a strong future as a leading data visualization and analysis tool.
Will anything replace Python?
Given its wide range of applications and flexibility, it is unlikely that any tool or language will completely replace Python.
Does Tableau require coding skills?
A basic understanding of data structures and SQL can be helpful for more complex analyses in Tableau, but Tableau can be used without advanced coding skills.
Is Python enough for data analytics?
Python can be a valuable tool for data analytics, but other skills like data visualization and statistical analysis may also be required for more advanced analyses.
Is learning Tableau enough to get a job?
Proficiency in Tableau can be valuable for many data-related jobs, but other skills like data analysis and programming may also be required for some positions.
Can I learn Python at 45 and get a job?
Age is not a barrier to learning programming skills like Python, and many companies value diversity and experience in their hiring practices.
What is the hardest programming language?
The hardest programming language depends on the user’s prior experience and specific learning style, but some commonly cited difficult languages include Assembly, C++, and Haskell.
Is 2 weeks enough to learn Python?
Two weeks may be enough time to learn some basic Python concepts and syntax, but proficiency in the language usually requires more dedicated effort and practice.
Which software is best for dashboards in Python?
Python has several libraries for creating interactive data dashboards, including Plotly and Dash.
How do I automate a Tableau dashboard in Python?
Tableau can interface with Python for more advanced analyses and automation, including automating the creation and updating of Tableau dashboards. Libraries like Tableau Server Client can automate Tableau server and dashboard tasks.
Power BI Alternatives
Several alternatives to Power BI, including Tableau, QlikView, and Looker. Each tool has unique strengths and weaknesses, so it’s important to carefully evaluate your needs and budget before deciding.
What is comparable to Power BI?
Tableau and QlikView are two of the most popular alternatives to Power BI. Both tools offer powerful data visualization and analysis capabilities and robust data integration and sharing features.
Is Tableau better than Power BI?
Whether Tableau is better than Power BI depends on your needs and preferences. Both tools offer similar functionality, but Tableau may be better for organizations prioritizing data visualization and analysis. At the same time, Power BI may be better suited for those focused on data integration and sharing.
Is Tableau Public free?
Tableau Public is a free data visualization tool allowing users to create and share interactive dashboards and reports. However, it does have some limitations, such as a maximum data storage limit of 10GB and the requirement that all data and visualizations be public.
How long will it take to learn Tableau?
The time it takes to learn Tableau depends on your prior experience with data analysis and visualization tools and your dedication and commitment to learning.
However, with consistent effort, many users can become proficient in Tableau within a few weeks to a few months.
Is Tableau no longer free?
While Tableau Public is a free tool, Tableau Desktop, and Tableau Server require a paid license. Additionally, Tableau offers several pricing tiers based on your organization’s needs and size.
Is SQL used in Tableau?
Yes, SQL is a common language used in Tableau for data querying and manipulation. Tableau has built-in support for connecting to and querying SQL databases and other data sources such as Excel spreadsheets and cloud-based platforms.
Does Salesforce own Tableau?
Yes, Salesforce acquired Tableau in 2019 in a $15.7 billion deal. However, Tableau continues to operate as an independent business unit within Salesforce, and its products and services are still available for use by organizations outside of the Salesforce ecosystem.
Can I get a job by just learning Tableau?
While learning Tableau can be a valuable skill for data analysts and business intelligence professionals, it is not a guarantee of employment. Many factors, such as prior work experience and education, also play a role in securing a job in the field.
Why is Tableau difficult?
Tableau can be difficult to learn and use for a few reasons, including its steep learning curve, its reliance on complex data structures, and its requirement for advanced data analysis skills. However, with practice and perseverance, many users can overcome these challenges and become proficient in the tool.
Can Tableau be self-taught?
Many people have successfully taught themselves how to use Tableau through online tutorials, videos, and practice exercises.
However, a formal training course or certification program may be helpful for those who prefer a more structured learning environment or need to demonstrate their Tableau skills to potential employers.
Open Source Power BI Alternative
One of the most popular open-source alternatives to Power BI is Metabase. Metabase is a free and open-source business intelligence tool that allows you to create charts, dashboards, and reports using a simple and intuitive interface.
With Metabase, you can connect to various data sources, including SQL databases, Google Analytics, and more. It also provides a wide range of visualization options and the ability to create custom dashboards.
Free Power BI Alternatives
There are several free alternatives to Power BI that you can consider, including Google Data Studio, Tableau Public, and Qlik Sense Desktop.
Power BI Alternatives for Mac
If you’re looking for a Power BI alternative for Mac, some good options include Tableau Desktop and Looker.
Conclusion
Here are the best Power BI Alternatives you can check out. Today, data plays a vital role in every business operation, whether marketing, logistics, or distribution.
All of these functions and more depend on decisions made using accurate data. No matter the size of the enterprise, a business intelligence tool is necessary to deliver the right results to the customers and stakeholders.
When deciding on purchasing a business intelligence tool, two points that should be considered on a priority basis are the number of users of that software and the availability of technical knowledge in the organization.
Users can begin researching software that fulfills their other specific needs depending on these two factors.