


In the tech-saturated business world, collecting and storing data is not enough.
The real challenge is effectively analyzing and using that data to inform decision-making, optimize processes, and predict future trends.
But with so many tools available, selecting the right data analytics platform for your business can be daunting. Two major contenders in the market are Datadog and Splunk.
Choosing the wrong platform could mean missing crucial insights, wasting resources, and making ill-informed business decisions.
Imagine having abundant data but being unable to convert it into actionable information. The pressure to choose the right tool is high, especially when the choices include renowned platforms like Datadog and Splunk.
Both have their strengths and can offer unique value to businesses, but they also have differences that could significantly impact their effectiveness within your unique organizational context.
To help you make an informed decision, we’ve comprehensively compared these powerful tools: Datadog vs Splunk.
We’ll delve into their features, capabilities, pricing structures, and more, providing a balanced analysis that enables you to choose the solution that best meets your business’s data analytics needs.
You can turn your data into your most valuable asset with the right information. So, let’s dive into the world of Datadog and Splunk to determine which is the right fit for you.
What is Datadog?🤷♂️
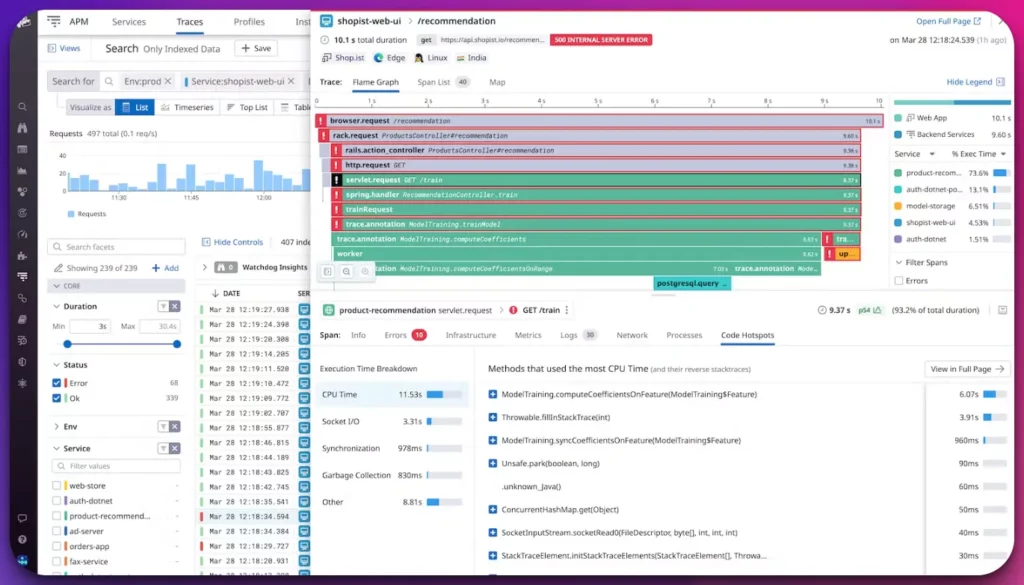
Datadog is a cutting-edge monitoring and analytics platform that empowers organizations to gain deep insights into the performance of their complex cloud infrastructure and applications.
With its robust set of features and user-friendly interface, Datadog has emerged as a frontrunner in the field of observability.
Datadog’s holistic approach encompasses real-time monitoring, tracing, logs management, and metrics visualization, providing a comprehensive view of system health.
Its powerful capabilities allow businesses to proactively identify and resolve issues, ensuring optimal performance and enhanced user experience.
Through agent-based monitoring, Datadog collects a vast array of data points, including CPU usage, network traffic, memory consumption, and error rates.
This wealth of information enables organizations to leverage machine learning algorithms and advanced analytics to identify patterns, detect anomalies, and gain valuable insights into their systems.
The platform’s visualization tools enable users to create customizable dashboards that display critical metrics and trends in a visually appealing manner.
Datadog’s alerting system is highly flexible and allows for proactive notifications, ensuring prompt response to potential issues.
Datadog’s versatility extends beyond infrastructure monitoring, as it supports integration with various cloud providers, container platforms, and third-party services.
This facilitates seamless integration into existing technology stacks, ensuring a unified monitoring experience.
In conclusion, Datadog is a robust and comprehensive observability platform that empowers organizations to gain valuable insights into their complex infrastructures, optimize performance, and deliver exceptional user experiences.
What is Splunk?
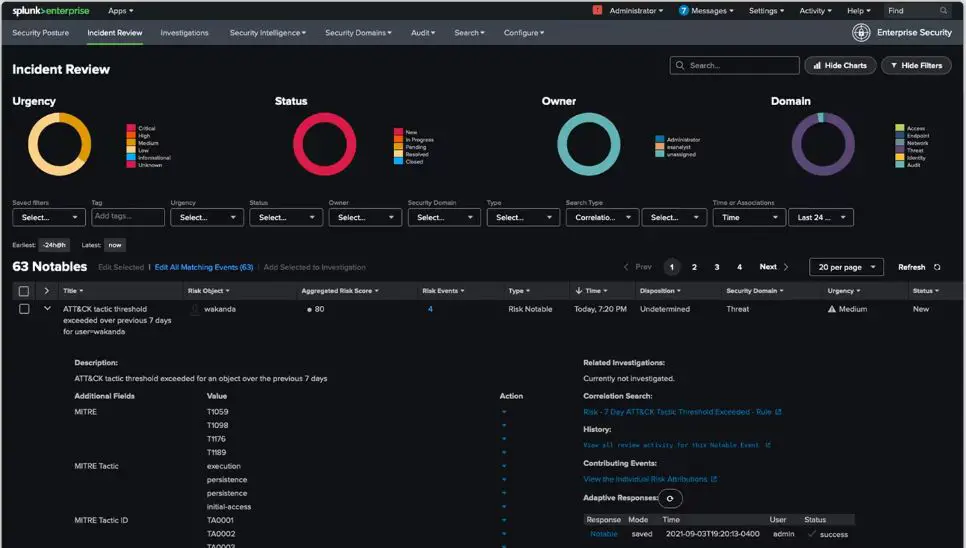
Splunk is an innovative data analysis and visualization platform that empowers organizations to unlock the hidden value of their vast data sets.
It is a powerful tool for extracting actionable insights from diverse sources, enabling businesses to make informed decisions and drive success.
At its core, Splunk is a log management and analytics solution designed to aggregate, index, and search machine-generated data in real-time.
It acts as a centralized repository for logs, events, and metrics, allowing users to navigate and explore data with its intuitive search interface easily.
With Splunk’s powerful search capabilities and machine learning algorithms, users can perform advanced data analysis, uncovering correlations, patterns, and anomalies that might otherwise go unnoticed.
This proactive approach to data analysis enables businesses to identify security threats, troubleshoot issues, and optimize performance.
Beyond log analysis, Splunk supports data ingestion from various sources, including applications, network devices, cloud platforms, and more.
This flexibility ensures organizations can gather insights from their IT infrastructure, driving a comprehensive understanding of their systems.
Splunk’s robust visualization tools enable users to create custom dashboards and report that present data in a visually appealing and easily digestible format.
By leveraging interactive visualizations and real-time monitoring, organizations can gain real-time insights and take swift action when necessary.
In summary, Splunk is a powerful data analysis and visualization platform that empowers organizations to extract valuable insights from diverse data sources.
Its advanced search capabilities, machine learning algorithms, and flexible data ingestion make it a valuable tool for businesses leveraging their data for improved decision-making and operational excellence.
Comparing Datadog and Splunk
Similarities between Datadog and Splunk
While they have unique features, several key similarities between Datadog and Splunk make them comparable organizational choices.
Let’s explore these similarities in detail.
1. Data Collection and Aggregation
Both Datadog and Splunk excel in data collection and aggregation capabilities. They enable organizations to gather data from various sources, including logs, metrics, events, and traces.
This extensive data collection allows businesses to understand their systems and applications comprehensively.
Datadog and Splunk offer efficient mechanisms to aggregate, index, and store this data, ensuring it is readily available for analysis and troubleshooting.
2. Real-time Monitoring and Alerting
Real-time monitoring is a critical aspect of modern IT operations. Both Datadog and Splunk provide robust solutions for real-time monitoring.
They offer capabilities to track and visualize the performance metrics of applications, infrastructure, and services.
With real-time system visibility, organizations can promptly identify and address potential issues, ensuring high availability and optimal performance.
Furthermore, both platforms offer alerting mechanisms that notify stakeholders when predefined thresholds or anomalies are detected, allowing for quick response and mitigation.
3. Visualization and Dashboards
Datadog and Splunk provide visualization tools that enable users to create customizable dashboards to present data visually appealing and informatively.
These dashboards allow stakeholders to monitor key performance indicators, metrics, and trends at a glance. Users can leverage visualization types like charts, graphs, heatmaps, and maps to represent data and gain insights.
The ability to customize these visualizations empowers organizations to tailor the monitoring experience to their specific needs.
4. Machine Learning and Analytics
Both Datadog and Splunk offer advanced machine learning and analytics capabilities that enable organizations to derive valuable insights from their data.
Machine learning algorithms can identify patterns, anomalies, and correlations within the data, helping businesses uncover hidden insights and potential issues.
These platforms facilitate advanced analytics by providing features such as anomaly detection, predictive analytics, and root cause analysis, allowing organizations to address issues and optimize their systems’ performance proactively.
5. Integration and Extensibility
Datadog and Splunk understand the importance of seamless integration within the IT ecosystem.
They provide extensive integration options for various technologies, services, and tools. Both platforms offer integrations with popular cloud providers, container platforms, databases, and various third-party services.
This integration capability ensures that organizations can aggregate data from multiple sources into a unified view, providing a comprehensive understanding of their IT landscape.
6. Scalability and Performance
In today’s era of ever-growing data volumes, scalability, and performance are crucial factors for monitoring and analytics platforms.
Datadog and Splunk are designed to handle large-scale data ingestion, processing, and storage.
They utilize distributed architectures and scalable infrastructure to accommodate growing data requirements.
This ensures that organizations can rely on these platforms as their data volumes increase without compromising performance or responsiveness.
7. Extensive Ecosystem and Community Support
Datadog and Splunk have cultivated extensive ecosystems and vibrant communities around their platforms.
They provide a rich marketplace of integrations, apps, and extensions developed by platform providers and the community.
These integrations and extensions enhance the functionality and extensibility of the platforms, enabling organizations to tailor the monitoring and analytics experience to their unique needs.
The communities surrounding Datadog and Splunk offer valuable resources, such as forums, knowledge bases, and user groups, where users can seek assistance, share best practices, and learn from each other’s experiences.
8. Focus on Customer Success
Both Datadog and Splunk prioritize customer success and offer comprehensive support and services. They provide documentation, training materials, and webinars to help users maximize the value of the platforms.
Additionally, they offer technical support and professional services to assist organizations in onboarding, configuration, and troubleshooting.
The dedication to customer success ensures businesses can effectively leverage the platforms to achieve their monitoring and analytics goals.
In conclusion, Datadog and Splunk share several key similarities that make them formidable contenders in monitoring and analytics.
Their capabilities in data collection, real-time monitoring, visualization, machine learning, integration, scalability, and customer support empower organizations to gain insights, identify issues, and optimize their IT environments.
Whether businesses choose Datadog or Splunk, they can expect robust solutions that enable them to enhance performance, ensure reliability, and drive success in today’s complex technology landscapes.
Differences between Datadog and Splunk

In the realm of monitoring and analytics platforms, Datadog and Splunk stand out as powerful solutions that enable organizations to gain insights into their IT infrastructure and applications.
While these platforms share similarities, they exhibit distinct differences that set them apart regarding features, architecture, and target use cases.
Let’s delve into the key differences between Datadog and Splunk.
1. Data Collection and Scope
One notable difference between Datadog and Splunk is their approach to data collection and the scope of the data they handle.
Datadog primarily focuses on real-time monitoring and emphasizes metrics and application performance. It efficiently collects and analyzes metrics and traces from various sources, enabling organizations to monitor the health and performance of their systems.
On the other hand, Splunk has a broader focus on log management and machine-generated data.
It excels in ingesting and indexing large volumes of logs, events, and other data types, allowing organizations to gain insights from various sources beyond metrics alone.
2. User Interface and Visualization
The user interface and visualization capabilities of Datadog and Splunk also exhibit differences.
Datadog provides a streamlined and intuitive interface with pre-built dashboards and widgets, allowing users to access critical information quickly.
Its visualization focuses on metrics-based charts and offers interactive capabilities for exploring data. In contrast, Splunk offers a highly customizable and flexible interface.
It empowers users to create tailored dashboards and visualizations using its powerful search language and visualization options.
Splunk’s interface is particularly well-suited for log analysis and creating complex, data-rich visualizations.
3. Search and Query Language
The search and query language employed by Datadog and Splunk is another area of distinction. Datadog utilizes a metrics-based query language designed for efficiently retrieving and aggregating time-series data.
This query language is well-suited for metrics-driven use cases, enabling users to perform advanced analysis on metrics data.
In contrast, Splunk employs a robust search language that provides powerful capabilities for searching, filtering, and correlating diverse data sources.
It allows users to perform complex searches and leverage the flexibility of regular expressions and advanced operators for log analysis and data exploration.
4. Machine Learning and Advanced Analytics
While both platforms offer machine learning and advanced analytics capabilities, there are differences in their approach.
Datadog integrates machine learning algorithms into its platform to provide features such as anomaly detection and forecasting for metrics-based data. These capabilities enable organizations to identify and address performance issues proactively.
On the other hand, Splunk offers a broader range of machine learning and advanced analytics features.
It supports custom machine learning models and provides functionalities like cluster analysis, predictive modeling, and correlation searches.
These capabilities empower organizations to derive insights from diverse data sources, including logs, events, and metrics.
5. Extensibility and Ecosystem
Regarding extensibility and integrations, Datadog and Splunk offer rich ecosystems, but with some differences.
Datadog provides many out-of-the-box integrations with popular technologies, cloud platforms, and third-party services.
This extensive integration library simplifies collecting data from various sources and enables organizations to extend their monitoring capabilities effortlessly.
On the other hand, Splunk strongly focuses on customizability and provides development platforms and APIs that allow users to build and customize their own integrations and applications.
This flexibility makes Splunk well-suited for organizations with unique and specific integration requirements.
6. Licensing and Cost Model
One practical difference between Datadog and Splunk is their licensing and cost models.
Datadog operates on a subscription-based model, where users pay based on the required features and resources, such as the number of monitored hosts or data retention. This model offers scalability and cost predictability.
On the other hand, Splunk employs a perpetual licensing model based on data ingestion volume. Users purchase a license based on the amount of data they anticipate ingesting into the platform.
This licensing approach can benefit organizations with significant data volumes and long-term usage plans.
In conclusion, while Datadog and Splunk are powerful monitoring and analytics platforms, they exhibit distinct differences in data collection, focus areas, user interface, search languages, machine learning capabilities, extensibility, and licensing models.
Organizations should carefully evaluate their specific requirements and use cases to determine which platform best fits their needs.
Whether the focus is on real-time metrics-based monitoring or comprehensive log analysis, Datadog and Splunk offer robust solutions to empower organizations in their quest for efficient monitoring, data analysis, and operational excellence.
Datadog vs Splunk: Detailed Comparison

Datadog vs Splunk: Performance
When comparing Datadog and Splunk in terms of performance, it’s essential to consider various factors that contribute to the effectiveness and efficiency of these monitoring and analytics platforms.
Datadog is widely recognized for its real-time monitoring capabilities and a strong focus on metrics-based analysis.
It collects, aggregates, and visualizes time-series data from diverse sources. Datadog’s architecture is designed for high-performance data ingestion and processing, enabling organizations to monitor their systems with minimal latency.
With its distributed data processing capabilities, Datadog can handle high data volumes while ensuring responsive analytics and visualizations.
This scalability allows businesses to monitor and analyze their infrastructure in real-time, supporting rapid decision-making and issue resolution.
On the other hand, Splunk offers a comprehensive platform for log management and machine-generated data analysis. Its strength lies in its ability to handle large-scale data ingestion and indexing.
Splunk’s performance is particularly notable when dealing with vast volumes of logs and events, allowing organizations to efficiently search and analyze extensive historical data.
The platform’s robust indexing mechanisms and search capabilities enable quick data retrieval, making it well-suited for in-depth log analysis and forensic investigations.
While both Datadog and Splunk excel in performance, their areas of focus and strengths differ. Datadog’s real-time monitoring capabilities and metrics-driven approach provide near-instantaneous insights into system performance.
On the other hand, Splunk offers powerful log analysis capabilities for detailed investigations and historical analysis.
Depending on an organization’s specific monitoring and analytics needs, the choice between Datadog and Splunk may vary based on performance requirements and data types.
Datadog vs Splunk: User Interface
When comparing the user interface of Datadog and Splunk, it becomes evident that both platforms have distinct approaches to presenting and visualizing data for monitoring and analytics purposes.
Datadog offers a streamlined and intuitive user interface that prioritizes ease of use and accessibility. Its interface features pre-built dashboards and widgets, allowing users to access and analyze critical information quickly.
Datadog’s user interface focuses on providing real-time visibility into system performance through metrics-based charts and graphs.
The interface emphasizes simplicity and enables users to interactively explore data, zoom in on specific time ranges, and drill down into detailed metrics.
This intuitive interface design makes it easier for users to navigate and gain insights from their data without extensive training or technical expertise.
On the other hand, Splunk provides a highly customizable and flexible user interface that empowers users to tailor their monitoring and analytics experience to their specific needs.
Splunk’s interface allows users to create custom dashboards and visualizations using its powerful search language and diverse visualization options.
Users can leverage a wide range of chart types, maps, and tables to present data meaningfully. Splunk’s interface is particularly well-suited for organizations that require advanced log analysis, as it provides extensive capabilities for searching, filtering, and correlating log data.
Its flexibility enables users to create complex, data-rich visualizations that cater to specific use cases and requirements.
In conclusion, while Datadog and Splunk offer powerful monitoring and analytics capabilities, their user interfaces exhibit distinct characteristics. Datadog prioritizes simplicity and real-time visibility through intuitive pre-built dashboards and interactive charts.
On the other hand, Splunk focuses on customization and flexibility, allowing users to create tailored dashboards and visualizations using its search language and advanced visualization options.
Organizations should consider their specific monitoring needs and the level of customization required when choosing between Datadog and Splunk based on user interface preferences.
Datadog vs Splunk: Integration Capabilities
When comparing the integration capabilities of Datadog and Splunk, it becomes clear that both platforms offer extensive options to connect and integrate with various technologies, services, and tools.
However, there are notable differences in the scope and flexibility of their integration capabilities.
Datadog is renowned for its vast library of out-of-the-box integrations. It integrates various technologies, including popular cloud providers, container platforms, databases, and third-party services.
This comprehensive integration support allows organizations to aggregate data from diverse sources into a unified view, enabling a holistic monitoring experience.
Datadog’s integration capabilities make it an excellent choice for organizations seeking a straightforward, streamlined integration process with minimal development or configuration efforts.
On the other hand, Splunk emphasizes customizability and provides flexible options for integration. It offers development platforms and APIs that enable users to build their integrations and applications.
This extensibility allows organizations to tailor Splunk to their needs, accommodating unique integration requirements and proprietary technologies.
Splunk’s focus on customization makes it an ideal choice for organizations that require fine-grained control over their integration processes and want to leverage their existing infrastructure and tools.
In summary, their approaches differ, while Datadog and Splunk offer robust integration capabilities. Datadog’s strength lies in its extensive library of out-of-the-box integrations, enabling organizations to connect with a wide range of technologies quickly.
On the other hand, Splunk prioritizes customizability, providing development platforms and APIs for organizations to build their own integrations.
Businesses should evaluate their specific integration requirements and consider the level of customization needed when choosing between Datadog and Splunk based on their integration capabilities.
Datadog vs Splunk: Pricing
When comparing the pricing models of Datadog and Splunk, it’s important to consider their different approaches in structuring the costs for the services they provide.
Datadog operates on a subscription-based pricing model. It offers multiple tiers of pricing plans, each with different features and resource allocations.
The subscription cost typically scales based on the number of monitored hosts or the volume of data ingested and stored. This model allows organizations to choose a plan that aligns with their needs and budget.
It allows businesses to scale their monitoring capabilities according to their requirements, ensuring cost efficiency.
On the other hand, Splunk employs a perpetual licensing model with pricing based on the data ingested into the platform.
Organizations purchase a license that grants them the right to ingest a certain volume of data into Splunk.
This licensing model can be advantageous for organizations with substantial data volumes and long-term usage plans, as it provides cost predictability and avoids the need for recurring subscriptions.
It’s important for organizations to carefully evaluate their anticipated data volumes and usage patterns when considering the pricing of Datadog and Splunk.
The subscription-based model of Datadog allows for flexibility and scaling as needs change.
In contrast, the perpetual licensing model of Splunk can be advantageous for long-term usage and high-volume data ingestion.
Organizations should assess their specific requirements and financial considerations to make an informed decision based on their budget and usage patterns.
Datadog vs Splunk: Reliability
When comparing the reliability of Datadog and Splunk, both platforms demonstrate strong performance and robustness in ensuring the availability and stability of their services.
Datadog is known for its highly reliable infrastructure, designed to handle the monitoring and analytics needs of organizations of all sizes.
It leverages a distributed architecture that enables fault tolerance and resilience against potential failures.
Datadog’s infrastructure is built to scale dynamically to accommodate varying workloads and data volumes, ensuring consistent performance even during peak usage.
The platform’s redundant data storage and backup mechanisms contribute to its reliability, ensuring data integrity and availability.
Splunk also offers a highly reliable platform for monitoring and analysis. It employs a distributed and scalable architecture that supports high availability and fault tolerance.
Splunk’s architecture allows for horizontal scalability, enabling organizations to handle large volumes of data and maintain performance.
Additionally, Splunk offers data replication and redundancy options, ensuring data durability and minimizing the risk of data loss. The platform’s focus on reliability is evident in its ability to deliver consistent results and maintain operational stability.
Both Datadog and Splunk recognize the criticality of maintaining reliable services for their users. Their investments in infrastructure design, fault tolerance mechanisms, and scalability contribute to their overall reliability.
Organizations can rely on Datadog and Splunk to deliver consistent performance and ensure their monitoring and analytics requirements are met without compromising reliability.
Datadog vs Splunk: Learning Curve
When considering the learning curve associated with Datadog and Splunk, it’s important to understand the differences in their user interfaces, functionalities, and underlying technologies.
Datadog offers a relatively gentle learning curve for users. Its intuitive and user-friendly interface allows users to navigate and access important information quickly. The platform provides pre-built dashboards and widgets that simplify the monitoring and analytics process.
Additionally, Datadog focuses on metrics-based analysis, which can be easier for users familiar with metrics data. The straightforward setup process and guided workflows further contribute to the ease of learning and adoption.
On the other hand, Splunk has a steeper learning curve due to its more customizable and flexible nature. Its user interface provides extensive options for customization, which may require more time and effort to master.
Splunk’s powerful search language and diverse functionalities, such as complex log analysis and correlation searches, require a deeper understanding and familiarity with the platform.
Users who are experienced with scripting or have a background in data analysis may find it easier to adapt to Splunk’s capabilities.
Ultimately, the learning curve for Datadog and Splunk depends on the user’s background, familiarity with monitoring and analytics concepts, and specific use cases.
Organizations should consider their team’s skill sets and available resources when evaluating the learning curve associated with each platform.
Training resources, documentation, and community support can also accelerate the learning process for Datadog and Splunk.
Datadog vs Splunk: Reporting
When comparing Datadog and Splunk in terms of reporting, it’s important to consider the capabilities and features each platform offers for generating and presenting data-driven reports.
Datadog provides robust reporting features that allow users to create comprehensive reports to communicate key metrics and insights.
With Datadog, users can generate customized reports that include a wide range of metrics, charts, and visualizations. The platform offers templated reports that cover common use cases, making it easier to get started.
Datadog’s reporting functionality also allows for automated report generation, enabling users to schedule and distribute reports to stakeholders.
The ability to incorporate real-time and historical data into reports helps organizations track performance trends and make informed decisions.
On the other hand, Splunk offers powerful reporting and visualization capabilities that enable users to extract valuable insights from their data.
Splunk’s search language allows for complex queries and data manipulation, facilitating in-depth analysis for report generation. The platform provides customizable dashboards that can be tailored to specific reporting needs.
Additionally, Splunk offers report acceleration for faster report generation and report scheduling for automated delivery.
With Splunk’s reporting capabilities, users can gain a comprehensive understanding of their data and communicate key findings effectively.
Both Datadog and Splunk offer rich reporting functionalities, but their approaches differ.
Datadog emphasizes simplicity and ease of use, providing templated reports and automated report generation.
Splunk, on the other hand, focuses on flexibility and customization, enabling users to perform advanced queries and tailor reports to their specific requirements.
In conclusion, when it comes to reporting, organizations should consider their specific reporting needs, data sources, and the level of customization required.
Datadog’s user-friendly interface and templated reports may suit those seeking simplicity, while Splunk’s advanced search language and customizable dashboards may appeal to users who require more flexibility and control over their reporting processes.
Ultimately, the choice between Datadog and Splunk for reporting depends on the unique reporting requirements and preferences of the organization.
Datadog vs Splunk: Observability in the Cloud
In the era of cloud computing, ensuring observability is crucial for organizations to gain deep insights into their cloud infrastructure and applications.
When comparing Datadog and Splunk in terms of observability in the cloud, it’s essential to consider their capabilities and approaches to monitoring, tracing, and logging.
Datadog provides a comprehensive observability platform that excels in monitoring cloud environments.
With its real-time metrics, organizations can monitor the performance and health of their cloud infrastructure, track resource utilization, and detect anomalies.
Datadog’s distributed tracing capabilities enable users to trace requests across microservices and identify bottlenecks or latency issues.
Additionally, Datadog offers centralized logging that allows organizations to collect, analyze, and gain insights from their application and infrastructure logs.
With its seamless integrations with major cloud providers, Datadog provides a unified view of the cloud environment, empowering organizations to achieve end-to-end observability.
On the other hand, Splunk offers a robust platform for collecting, analyzing, and visualizing machine-generated data.
With Splunk’s log analytics capabilities, organizations can ingest and analyze logs from cloud infrastructure and applications, gaining insights into system behavior, errors, and performance.
Splunk’s real-time monitoring enables users to track key metrics and detect anomalies. Additionally, Splunk’s distributed tracing allows organizations to trace requests and identify performance issues across their cloud architecture.
While both Datadog and Splunk excel in observability in the cloud, their approaches differ. Datadog offers a comprehensive observability platform with emphasis on real-time metrics, distributed tracing, and centralized logging.
Splunk, on the other hand, focuses on log analytics and real-time monitoring.
Organizations should consider their specific observability needs, such as the scale and complexity of their cloud environment, the level of granularity required, and integration capabilities when evaluating Datadog and Splunk for achieving observability in the cloud.
Case Studies of Successful Implementation of Datadog
Implementing a robust monitoring and analytics solution like Datadog has proven instrumental in the success of many organizations across various industries.
Let’s delve into a few compelling case studies highlighting the benefits and outcomes of leveraging Datadog for monitoring, troubleshooting, and optimizing IT environments.
Case Study 1: eCommerce Giant
A global eCommerce giant faced challenges in ensuring optimal performance and availability of its online platform.
By implementing Datadog, they gained real-time visibility into their infrastructure and applications, enabling them to identify and resolve issues proactively.
Datadog’s metrics monitoring allowed them to track key performance indicators, such as response times and error rates and set up customizable alerts to detect anomalies.
With Datadog’s unified view, they could quickly pinpoint bottlenecks and optimize their systems for peak performance.
Datadog’s log management capabilities also helped them analyze application logs and identify potential issues.
The successful implementation of Datadog resulted in reduced downtime, improved customer satisfaction, and increased revenue for the eCommerce giant.
Case Study 2: Cloud-Native SaaS Provider
A cloud-native SaaS provider sought a comprehensive monitoring solution to gain visibility into their dynamic, containerized infrastructure.
They chose Datadog for its robust container monitoring capabilities. With Datadog’s container orchestration integration, they gained insights into the performance and health of their containerized applications.
The platform’s auto-discovery feature automatically detected new containers and services, eliminating the need for manual configuration.
Datadog’s real-time dashboards allowed them to visualize critical metrics, monitor resource utilization, and identify performance bottlenecks.
The SaaS provider leveraged Datadog’s alerting and anomaly detection to address issues before they impacted users proactively.
By successfully implementing Datadog, the SaaS provider, they achieved efficient cloud monitoring, optimized resource utilization, and improved scalability for their rapidly growing customer base.
Case Study 3: Media Streaming Service
A leading media streaming service relied on Datadog to ensure a seamless streaming experience for millions of users worldwide.
With Datadog’s real-time monitoring and distributed tracing, they gained end-to-end visibility into their complex microservices architecture.
The platform enabled them to quickly identify and quickly resolve performance issues, such as latency spikes and service degradation.
Leveraging Datadog’s application performance monitoring (APM), they analyzed code-level performance and detected anomalies in their application stack.
This allowed them to optimize their code, reduce latency, and enhance the streaming experience. Additionally, Datadog’s scalable infrastructure ensured they could handle the massive influx of concurrent streams during peak usage.
The successful implementation of Datadog contributed to increased user engagement, reduced customer churn, and strengthened the media streaming service’s market position.
Case Study 4: Finance and Banking Institution
A renowned finance and banking institution implemented Datadog to strengthen its security posture and ensure regulatory compliance.
With Datadog’s compliance monitoring features, they could track and analyze security events, identify anomalies, and maintain audit trails.
The institution leveraged Datadog’s log management capabilities to collect and analyze security logs, allowing them to detect potential threats and respond promptly.
Datadog’s incident management facilitated efficient collaboration and communication during security incidents, enabling the institution to mitigate risks effectively.
Furthermore, Datadog’s integration with security tools allowed them to centralize security monitoring across their diverse infrastructure.
The successful implementation of Datadog enhanced the institution’s ability to safeguard customer data, maintain regulatory compliance, and uphold its reputation as a trusted financial entity.
These case studies highlight the diverse range of organizations that have succeeded by implementing Datadog.
By leveraging its comprehensive monitoring, troubleshooting, and optimization capabilities, businesses can enhance performance, improve user experience, ensure security, and drive operational efficiency.
Whether it’s a global eCommerce giant, a cloud-native SaaS provider, a media streaming service, or a finance and banking institution, the successful implementation of Datadog has been instrumental in achieving its monitoring and analytics goals.
Case Studies of Successful Implementation of Splunk
Splunk has been instrumental in driving success and innovation for numerous organizations across various industries.
Let’s explore some compelling case studies that showcase the benefits and outcomes of implementing Splunk for monitoring, analytics, and security.
Case Study 1: Telecommunications Provider
A leading telecommunications provider implemented Splunk to gain deep insights into their vast network infrastructure and customer experience.
By leveraging Splunk’s real-time monitoring capabilities, they could proactively identify and resolve network issues, reducing downtime and improving overall service quality.
Splunk’s data visualization and custom dashboards enabled them to gain real-time visibility into network performance, allowing for quick decision-making.
With Splunk’s machine learning capabilities, they could predict and prevent network outages, resulting in enhanced customer satisfaction and significant cost savings.
Case Study 2: Retail Chain
A large retail chain sought to improve its operational efficiency and enhance the customer experience.
By implementing Splunk, they gained end-to-end visibility into their IT infrastructure, including point-of-sale systems, inventory management, and customer data.
Splunk’s data analytics capabilities allowed them to identify sales trends, optimize inventory management, and personalize the customer experience.
Additionally, Splunk’s real-time alerts and predictive analytics enabled them to respond quickly to issues, prevent system failures, and proactively address potential security threats.
The successful implementation of Splunk empowered the retail chain to make data-driven decisions, optimize operations, and drive revenue growth.
Case Study 3: Healthcare Provider
A large healthcare provider implemented Splunk to strengthen its security posture and ensure compliance with stringent industry regulations.
Splunk’s security information and event management (SIEM) capabilities allowed them to centralize security logs, detect potential threats, and respond swiftly to security incidents.
By leveraging Splunk’s machine learning algorithms, they could proactively identify anomalous behavior and mitigate security risks.
Splunk’s correlation searches and incident response workflows streamlined its security operations, enabling them to investigate and resolve security incidents efficiently.
The successful implementation of Splunk enhanced their ability to protect patient data, achieve regulatory compliance, and maintain a secure environment for their infrastructure.
Case Study 4: Financial Services Firm
A financial services firm implemented Splunk to combat fraudulent activities and enhance its risk management practices.
By leveraging Splunk’s data analytics capabilities, they gained actionable insights into customer transactions, enabling them to identify fraudulent patterns and behaviors.
Splunk’s real-time alerts and automated workflows accelerated fraud detection and response times, reducing financial losses and protecting customers’ assets.
Additionally, Splunk’s compliance monitoring features helped them meet regulatory requirements and ensure the integrity of their operations.
The successful implementation of Splunk empowered the financial services firm to maintain trust, mitigate risks, and stay ahead against fraud.
These case studies exemplify the successful implementation of Splunk across diverse industries.
Whether it’s a telecommunications provider, a retail chain, a healthcare provider, or a financial services firm, Splunk has consistently delivered powerful insights, improved operational efficiency, and strengthened security practices.
Through its robust monitoring, analytics, and security capabilities, Splunk has become crucial in driving success, innovation, and competitive advantage for organizations worldwide.
Datadog vs Splunk vs Grafana
When it comes to monitoring and analytics, organizations often consider various solutions, including Datadog, Splunk, and Grafana.
Each platform offers unique features and capabilities to help businesses gain insights and make data-driven decisions.
Let’s compare these three platforms and explore their strengths and differentiators.
Datadog is known for its comprehensive observability platform that combines metrics monitoring, distributed tracing, and log management.
With Datadog, organizations can collect and analyze real-time metrics, trace requests across complex microservices architectures, and gain insights from logs.
The platform’s user-friendly interface and extensive library of integrations make it easy to set up and customize monitoring dashboards.
Splunk, on the other hand, specializes in log analytics and machine data intelligence. It excels at ingesting and analyzing large volumes of log data from diverse sources.
Splunk’s search language allows users to perform complex queries and correlations, enabling deep analysis and troubleshooting.
The platform’s scalability and robust features make it a popular choice for organizations that require in-depth log analysis and security monitoring.
Grafana is a powerful data visualization platform that excels at creating interactive and customizable dashboards.
It supports a wide range of data sources, including Datadog and Splunk, and allows users to create visually appealing graphs and charts.
Grafana’s flexible and extensible nature makes it a popular choice for organizations that want to create rich visualizations and share insights with stakeholders.
When comparing these platforms, it’s essential to consider factors such as ease of use, scalability, integration capabilities, and pricing.
Datadog offers a comprehensive, all-in-one solution with a focus on real-time metrics, distributed tracing, and log management.
Splunk specializes in log analytics and machine data intelligence, offering powerful search capabilities and scalability. Grafana shines in data visualization and dashboard creation, providing flexibility and compatibility with various data sources.
Ultimately, the choice between Datadog, Splunk, and Grafana depends on the specific needs and priorities of the organization.
Organizations looking for a unified monitoring and observability platform may find Datadog’s comprehensive feature set appealing. Those with a focus on log analysis and security monitoring may lean towards Splunk.
Meanwhile, organizations seeking powerful data visualization capabilities may opt for Grafana.
Evaluating the unique requirements and objectives of your organization will help you make an informed decision when choosing between Datadog, Splunk, and Grafana for your monitoring and analytics needs.
Datadog vs Splunk vs New Relic
When it comes to monitoring and analytics platforms, organizations often consider a range of solutions, including Datadog, Splunk, and New Relic.
Each platform offers unique features and capabilities to help businesses gain insights and optimize their operations.
Let’s compare these three platforms and explore their strengths and differentiators.
Datadog is a comprehensive observability platform that combines metrics monitoring, distributed tracing, and log management.
It offers real-time visibility into infrastructure performance, tracks key metrics, and detects anomalies. With its intuitive user interface and extensive library of integrations, Datadog provides organizations with the flexibility to monitor and analyze their data effectively.
Splunk specializes in log analytics and machine data intelligence. It excels at ingesting and analyzing vast volumes of log data from various sources.
Splunk’s powerful search capabilities and correlation features allow users to perform complex queries and gain deep insights into their data.
The platform’s scalability and advanced analytics make it a popular choice for organizations seeking comprehensive log analysis and security monitoring.
New Relic focuses on application performance monitoring (APM) and end-user experience management.
It enables organizations to monitor the performance of their applications, detect performance bottlenecks, and proactively resolve issues.
With its rich set of APM features, New Relic helps optimize application performance, improve customer experience, and drive business outcomes.
When comparing these platforms, several factors should be considered, including ease of use, scalability, integration capabilities, and pricing.
Datadog provides a comprehensive, all-in-one solution with a focus on real-time metrics, distributed tracing, and log management. Splunk offers powerful log analytics and machine data intelligence, allowing deep analysis and correlation.
New Relic specializes in application performance monitoring and end-user experience management, enabling organizations to optimize their applications and improve customer satisfaction.
Ultimately, the choice between Datadog, Splunk, and New Relic depends on the specific needs and objectives of the organization.
Organizations looking for a unified observability platform with a broad range of monitoring capabilities may find Datadog appealing.
Those seeking powerful log analytics and security monitoring may lean towards Splunk. Meanwhile, organizations prioritizing application performance and end-user experience management may opt for New Relic.
Evaluating the unique requirements, scalability, integration capabilities, and pricing structures will help organizations make an informed decision when choosing between Datadog, Splunk, and New Relic for their monitoring and analytics needs.
Each platform offers distinct advantages, and selecting the right one will depend on the specific goals and priorities of the organization.
📗FAQ’s
What is the difference between Datadog and Splunk?
Datadog and Splunk are both powerful monitoring and analytics tools, but they differ in their approach and focus. Datadog is known for its real-time metrics, distributed tracing, and log management capabilities, while Splunk specializes in log analytics and machine data intelligence.
What makes Datadog better?
Datadog stands out with its user-friendly interface, extensive integrations, and comprehensive observability features. It offers a unified platform for monitoring and analyzing infrastructure performance, application health, and log data.
Is Datadog a good monitoring tool?
Yes, Datadog is widely recognized as a top-tier monitoring tool. It provides real-time visibility into systems and applications, allowing organizations to proactively identify and address issues.
What is Datadog popularly used for?
Datadog is popularly used for monitoring and optimizing cloud infrastructure, tracking metrics, visualizing data, and detecting anomalies to enhance system performance and reliability.
Is Datadog a SIEM tool?
No, Datadog is not primarily a Security Information and Event Management (SIEM) tool. While it offers some security monitoring features, its core focus is on infrastructure and application monitoring.
Why is Splunk better?
Splunk shines in log analytics and correlation capabilities. It excels at ingesting and analyzing large volumes of log data, enabling organizations to gain valuable insights and detect patterns for troubleshooting and security purposes.
Who is Datadog’s competition?
Datadog faces competition from other observability and monitoring platforms such as New Relic, Dynatrace, and Elastic.
What makes Datadog unique?
Datadog’s uniqueness lies in its comprehensive observability platform, extensive integrations, and emphasis on real-time metrics, distributed tracing, and log management. Its user-friendly interface and flexibility make it stand out among its competitors.
What companies use Datadog?
Many companies across various industries rely on Datadog, including Airbnb, Spotify, Samsung, and PagerDuty. It caters to the monitoring needs of organizations of all sizes.
Why do companies need Datadog?
Companies need Datadog to gain real-time visibility into their systems, applications, and cloud infrastructure. It helps them proactively identify issues, optimize performance, and ensure the reliability of their digital services.
Is Grafana the same as Datadog?
No, Grafana is a data visualization and dashboarding tool that can integrate with Datadog and other data sources. It complements Datadog’s monitoring capabilities by providing customizable visualizations and dashboards.
Is Datadog a logging tool?
While Datadog offers log management capabilities, it is not solely a logging tool. It provides a comprehensive observability platform that encompasses metrics, traces, and logs.
Is Datadog a Chinese company?
No, Datadog is not a Chinese company. It is an American company founded in 2010 and headquartered in New York City.
What database does Datadog use?
Datadog primarily uses its proprietary time-series database to store and analyze monitoring data efficiently. It can also integrate with various third-party databases for additional functionality.
What is the ranking of Datadog company?
As of the latest rankings, Datadog is recognized as one of the leading companies in the observability and monitoring space.
Does Datadog use AWS?
Yes, Datadog can monitor and integrate with cloud services, including Amazon Web Services (AWS). It provides out-of-the-box integrations and monitoring capabilities for AWS resources.
Who is Datadog owned by?
Datadog is a publicly traded company and is not owned by any specific entity or individual. It has its own shareholder base.
Is Datadog cloud-based?
Yes, Datadog is a cloud-based monitoring platform. It operates in the cloud and offers its services through a Software-as-a-Service (SaaS) model.
Who are competitors to Splunk?
Splunk faces competition from various companies in the log management and analytics space, including Datadog, Elastic, Logz.io, and Sumo Logic.
Who is Splunk’s main competitor?
While Splunk competes with multiple companies, its main competitor in the log analytics market is Elasticsearch, the core component of the Elastic Stack.
Why not use Splunk?
Some organizations may choose not to use Splunk due to factors such as high licensing costs, complex setup and configuration, and resource-intensive requirements.
Is Datadog doing well?
Datadog has experienced significant growth since its inception and has established itself as a leading player in the monitoring and observability market.
Is Datadog a growing company?
Yes, Datadog is considered a fast-growing company, continuously expanding its customer base and increasing its market presence.
How big is Datadog?
Datadog is a sizable organization with a global presence. It has a large customer base and offices in multiple countries.
How fast is Datadog growing?
Datadog has demonstrated rapid growth, fueled by the increasing demand for cloud monitoring and observability solutions.
What is the future growth of Datadog?
The future growth of Datadog looks promising as the demand for monitoring and observability solutions continues to rise. The company’s innovative product offerings and market position contribute to its potential for further expansion.
What are the challenges with Datadog?
One challenge with Datadog is its complexity in handling large-scale environments and managing vast amounts of monitoring data. Additionally, organizations may face challenges in effectively configuring and customizing the platform to their specific needs.
Who are Datadog clients?
Datadog serves a wide range of clients, including small startups, mid-sized businesses, and large enterprises across various industries such as technology, e-commerce, finance, and healthcare.
How does Datadog make money?
Datadog generates revenue through a subscription-based model, offering different pricing tiers based on the level of functionality and support required.
Which cloud does Datadog use?
Datadog is a cloud-agnostic monitoring platform, meaning it can integrate with and monitor various cloud providers, including AWS, Microsoft Azure, and Google Cloud Platform.
Why is it called Datadog?
The name “Datadog” symbolizes the platform’s ability to track and monitor data, providing a watchful eye on an organization’s infrastructure and applications.
Is Datadog a cybersecurity company?
While Datadog offers some security monitoring features, it is not primarily focused on cybersecurity. It is more renowned as a monitoring and observability platform.
How well does Datadog pay?
Datadog is known for offering competitive compensation packages, including salaries and benefits, to attract top talent in the industry.
Can Grafana replace Splunk?
Grafana is primarily a visualization and dashboarding tool, whereas Splunk is a comprehensive log analytics and machine data intelligence platform. While Grafana can integrate with data sources such as Splunk, it does not replace the full functionality of Splunk.
Conclusion
Choosing the right data analytics platform is a critical decision that can significantly impact your business’s success and efficiency.
Datadog and Splunk are powerful tools, each with their strengths and unique offerings, deciding Datadog vs Splunk a complex one.
We’ve delved deep into both platforms’ features, capabilities, and pricing to arm you with the knowledge you need to make this important decision.
Remember, the best solution isn’t necessarily the one with the most features or the highest price tag. Instead, it’s the one that best aligns with your specific business needs and context.
Whether you require real-time monitoring and alerting, exceptional log management, superior visualization, or an intuitive and user-friendly interface, Datadog and Splunk have plenty to offer.
Ultimately, your choice will depend on your unique needs, budget, and long-term data strategy. Consider these factors carefully, and you’ll be well on your way to leveraging your data for maximum impact.
Remember, data is your most valuable asset, but only if you have the tools to unlock its full potential.