


Digital performance monitoring is an essential facet of every modern business. However, it’s not unusual for enterprises to find themselves stuck with a monitoring platform that doesn’t meet their unique needs.
Among these platforms, Dynatrace often springs to mind. Its robust features and comprehensive approach have made it a popular choice. But the truth is, it’s not the perfect fit for everyone. Whether due to cost, complexity, or a need for different functionalities, many businesses are constantly searching for better, more suitable Dynatrace alternatives.
Selecting the wrong monitoring tool can result in critical application performance issues going unnoticed, leading to potential loss of revenue and customer trust. The vast number of options available in the market further complicates this dilemma.
How can you be sure your alternative is a better fit than Dynatrace? This search can feel like looking for a needle in a haystack without proper guidance.
The key to finding the right Dynatrace alternative lies in understanding your requirements and being aware of the diverse range of digital performance monitoring solutions available.
This article will guide you through that journey, showcasing the top Dynatrace alternatives that could better match your organization’s needs. Each alternative will be evaluated based on ease of use, cost-effectiveness, and unique functionalities, among other factors, ensuring you make a well-informed decision that can help drive your business performance to new heights.
What is Dynatrace?🔭
Dynatrace is an esteemed name in application performance monitoring (APM) solutions, renowned for its unrivaled capabilities in optimizing and managing the performance of complex software environments.
As a popular choice among enterprises of varying sizes, Dynatrace empowers organizations to gain unparalleled insights into the performance and health of their critical applications, ensuring seamless user experiences and driving business success.
At its core, Dynatrace provides comprehensive monitoring across multi-cloud and hybrid environments, leveraging AI-powered automation to detect and diagnose issues in real-time.
By analyzing every transaction and correlating data across the entire technology stack, Dynatrace gives businesses a holistic view of their applications, infrastructure, and end-user experiences.
One of the distinctive features of Dynatrace is its ability to capture deep transaction details, including code-level visibility and distributed tracing, enabling organizations to identify and resolve performance bottlenecks with pinpoint accuracy. Furthermore, Dynatrace offers synthetic monitoring capabilities, allowing businesses to simulate user interactions and proactively identify potential performance issues.
Another notable aspect of Dynatrace is its emphasis on automation and self-healing, where the solution can automatically detect and resolve performance problems, ensuring continuous and optimal application performance.
This proactive approach saves valuable time and resources for businesses, enabling them to focus on driving innovation and delivering exceptional digital experiences to their users.
Dynatrace’s status as a leading APM solution is a testament to its advanced capabilities, unwavering commitment to innovation, and proven track record of helping organizations achieve and maintain peak application performance.
Why Do Organizations Need APM (Application Performance Monitoring) Tools?
In today’s digital world’s fast-paced and competitive landscape, businesses understand the critical importance of APM (Application Performance Monitoring) tools to monitor and optimize their applications. These tools ensure optimal performance, deliver superior user experiences, and drive business success.
APM tools enable businesses to gain deep visibility into the performance of their applications, providing real-time insights into various key metrics such as response times, resource utilization, and error rates.

By monitoring these critical parameters, organizations can proactively identify performance bottlenecks and take necessary actions to resolve them promptly, thus preventing potential downtime and revenue loss.
Moreover, APM tools offer comprehensive end-to-end monitoring, allowing businesses to track application performance across different layers, from backend infrastructure to front-end user experiences.
This holistic view helps organizations pinpoint issues and ensure smooth and consistent performance throughout the application stack. Additionally, APM tools empower businesses with data-driven insights to make informed decisions regarding application optimization.
By analyzing trends and patterns in performance metrics, organizations can identify areas for improvement, enhance application efficiency, and deliver enhanced user experiences.
These tools also facilitate capacity planning, enabling businesses to allocate resources effectively and scale their applications to meet growing demands.
In summary, the significance of APM tools for businesses cannot be overstated. They provide the means to monitor, analyze, and optimize application performance, resulting in improved user satisfaction, increased productivity, and a competitive edge in the market.
Understanding The Need for Dynatrace Alternatives
In today’s ever-evolving technological landscape, businesses constantly seek innovative solutions to address their diverse needs. As such, understanding the need for Dynatrace alternatives arises, prompting organizations to explore options that cater to their unique requirements.
While Dynatrace is a prominent application performance monitoring (APM) solution, several factors may lead businesses to consider alternatives. Budget considerations often play a significant role, as different APM solutions vary in pricing models and scalability options.
Organizations may find alternatives that align better with their financial constraints without compromising on crucial monitoring capabilities. The need for customizability is another factor that drives the search for alternatives. Businesses operate in diverse environments, each with its challenges and requirements.
By exploring other options, organizations can find APM solutions that offer tailored monitoring capabilities specific to their industry, technology stack, or use case. Moreover, technological advancements and the evolving nature of digital ecosystems create a demand for APM tools that can seamlessly integrate with emerging technologies.
Organizations may seek alternatives to ensure compatibility with cloud-native environments, microservices architectures, or containerization platforms. Understanding the need for Dynatrace alternatives is an essential step for businesses in their pursuit of finding the perfect APM solution.
By considering factors such as budget, customizability, and technological compatibility, organizations can explore a range of alternatives and select an APM tool that best suits their specific requirements.
Best Dynatrace Alternatives To Maximize Application Performance
1. Datadog
Datadog is one of the best alternatives to Dynatrace in application performance monitoring (APM).
With its robust feature set and comprehensive monitoring capabilities, Datadog provides businesses with a powerful platform to optimize and manage the performance of their critical applications.
One of the standout features of Datadog is its ability to offer end-to-end visibility into the entire application stack, including applications, infrastructure, logs, and user experiences.
By capturing and correlating data from multiple sources, Datadog enables organizations to gain a holistic view of their environment, making identifying and troubleshooting performance issues easier.
Datadog’s real-time analytics and alerting capabilities further enhance its effectiveness as an APM solution. The platform provides businesses with timely insights and proactive alerts, enabling them to detect anomalies, predict potential issues, and take proactive measures to maintain optimal application performance.
Additionally, Datadog’s support for cloud-native environments and containerization makes it an excellent choice for organizations embracing modern development practices.
It offers seamless integration with popular cloud providers and technologies, allowing businesses to monitor their applications regardless of the infrastructure they reside in.
With its user-friendly interface and intuitive dashboards, Datadog empowers technical and non-technical stakeholders to gain valuable insights into application performance.
Its scalability, extensive integration options, and strong customer support further solidify its position as a top-notch alternative to Dynatrace.
In conclusion, Datadog is one of the best alternatives to Dynatrace for businesses seeking a reliable and feature-rich APM solution.
Its comprehensive monitoring capabilities, real-time analytics, and support for modern environments make it an excellent choice for organizations looking to optimize their application performance and deliver exceptional user experiences.
Pros:-
Comprehensive monitoring:- Datadog APM offers various monitoring capabilities, including real-time application performance monitoring, error tracking, and distributed tracing. This enables teams to identify and resolve performance bottlenecks quickly.
Scalability:- Datadog APM is designed to handle high volumes of data and can scale to support applications of any size. It efficiently captures and analyzes performance metrics, even in complex and distributed environments.
Integrations:- Datadog APM integrates seamlessly with popular frameworks, languages, and platforms. It supports various programming languages, making it versatile and adaptable to different tech stacks.
Visualization and analytics:- The platform offers intuitive dashboards and visualizations, providing meaningful insights into application performance. Advanced analytics capabilities help teams identify trends, patterns, and anomalies.
Cons:-
Complex setup:- Setting up Datadog APM can be challenging, especially for organizations with complex environments. Configuring agents, instrumenting code, and ensuring compatibility across various technologies may require technical expertise.
Cost:- Datadog APM is a premium solution, and the cost may be a limiting factor for small or budget-constrained organizations. Pricing is typically based on data volume and the number of hosts monitored.
Learning curve:- Mastering Datadog APM’s features and leveraging its full potential may require a learning curve. Teams need to invest time and effort to utilize the platform effectively.
Limited on-premises support:- Datadog primarily focuses on cloud-based solutions, and on-premises deployments may have limited support compared to cloud-based environments.
In conclusion, Datadog APM offers comprehensive monitoring capabilities and valuable insights for optimizing application performance.
While it comes with some complexities and cost considerations, organizations investing in robust performance monitoring and analysis will find Datadog APM a valuable addition to their tech stack.
Customer Ratings:-
Trust Radius: Score 8.6 out of 10 (195+ reviews)
Capterra: 4.6/5 (217+ reviews)
G2: 4.3/5 (419+ reviews)
Dynatrace vs Datadog:-
Dynatrace and Datadog are leading application performance monitoring (APM) solutions offering unique features and capabilities.
While both platforms excel in monitoring and optimizing application performance, there are notable differences when comparing Dynatrace vs Datadog.
Dynatrace is renowned for its AI-powered automation and deep transactional visibility. It provides end-to-end monitoring across complex environments, allowing businesses to identify and resolve performance issues accurately.
Dynatrace also offers robust synthetic monitoring capabilities, enabling organizations to simulate user interactions and proactively detect potential bottlenecks.
On the other hand, Datadog shines with its comprehensive monitoring approach, covering applications, infrastructure, logs, and user experiences.
It emphasizes real-time analytics and proactive alerting, helping businesses detect anomalies and address performance issues promptly.
Datadog’s support for cloud-native environments and containerization makes it a preferred choice for organizations leveraging modern development practices.
When considering scalability and flexibility, Dynatrace is known for its ability to handle large-scale deployments, making it suitable for enterprises with complex and dynamic environments.
Datadog, conversely, provides a user-friendly interface and intuitive dashboards catering to technical and non-technical stakeholders.
Regarding pricing, Dynatrace tends to be more expensive, often targeted at larger enterprises with advanced monitoring needs. Datadog offers various pricing options, making it accessible to businesses of all sizes.
Here’s a comparison table highlighting some key differences between Dynatrace and Datadog:-
| Feature | Dynatrace | Datadog |
|---|---|---|
| Monitoring | Provides full-stack monitoring capabilities | Offers comprehensive monitoring features |
| APM | Offers advanced application performance monitoring | Provides application performance monitoring capabilities |
| Infrastructure | Provides infrastructure monitoring and management features | Offers infrastructure monitoring capabilities |
| Cloud Integration | Supports cloud-native monitoring and integration | Offers cloud monitoring and integration capabilities |
| Container Monitoring | Provides container monitoring and management capabilities | Offers container monitoring features |
| Real-time Analytics | Offers real-time analytics and problem detection | Provides real-time analytics and problem detection features |
| Alerting | Provides customizable alerting and notification capabilities | Offers customizable alerting and notification features |
| Dashboards | Offers customizable and interactive dashboards | Provides customizable and interactive dashboards |
| Anomaly Detection | Utilizes AI-powered anomaly detection capabilities | Provides AI-powered anomaly detection capabilities |
| Collaboration | Supports collaboration features for teams | Provides collaboration features for teams |
| Pricing | Has different pricing plans based on features and usage | Offers various pricing plans based on features and usage |
2. Instana
When considering Instana as a Dynatrace alternative, organizations gain access to a robust application performance monitoring (APM) solution that offers unique capabilities and features.
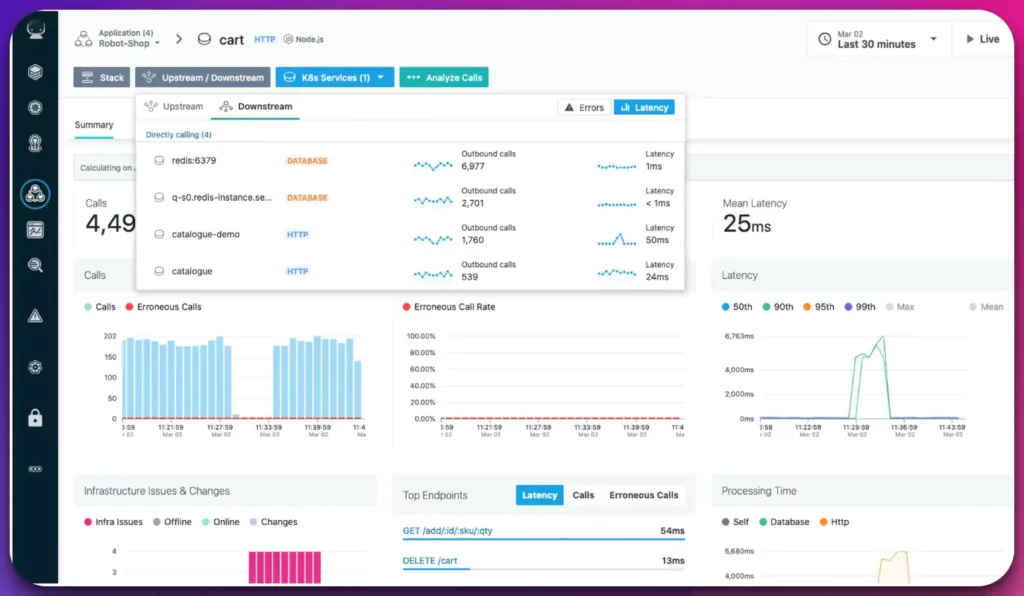
Instana sets itself apart by providing automated and real-time monitoring of applications and microservices in dynamic and cloud-native environments.
One of Instana’s standout features is its ability to discover and monitor application components, requiring minimal configuration automatically.
Through its automatic instrumentation, Instana collects granular data on application performance, including metrics on response times, latency, errors, and dependencies.
Moreover, Instana offers distributed tracing, allowing organizations to track and analyze the flow of requests across their microservices architecture.
This enables precise identification of performance bottlenecks and facilitates efficient troubleshooting.
Instana’s AI-powered capabilities enable it to dynamically baseline application performance, detect anomalies, and provide smart alerting, ensuring that businesses can proactively address potential issues.
Additionally, Instana provides end-to-end visibility into the entire technology stack, including applications, containers, orchestration platforms, and infrastructure.
This comprehensive view empowers organizations to gain insights into the health and performance of their applications, helping them optimize and deliver exceptional user experiences.
Instana offers a compelling alternative to Dynatrace with its automated monitoring, distributed tracing, AI-driven analytics, and comprehensive visibility.
By leveraging Instana, businesses can effectively monitor and optimize their applications, ensuring reliable performance and driving business success.

Pros:-
Automatic instrumentation:- Instana excels in automatic instrumentation, requiring minimal manual configuration. It uses AI-powered techniques to dynamically discover and monitor application components, providing a low-overhead implementation process.
End-to-end visibility:- Instana provides end-to-end visibility into the application stack, including microservices, containers, and infrastructure components. It enables detailed monitoring of every layer, facilitating quick identification and resolution of performance issues.
AI-driven root cause analysis:- Instana leverages AI and machine learning algorithms to perform automated root cause analysis. It correlates metrics, traces, and logs to pinpoint the exact cause of performance problems, reducing mean time to resolution.
Scalability:- Instana is designed to handle high-scale environments, making it suitable for large-scale deployments. It can efficiently monitor distributed systems and dynamically adjust to changes in the application architecture.
Cons:-
Complex pricing structure:- Instana’s pricing model can be complex, often based on the number of hosts, metrics collected, and retention periods. Organizations need to assess their needs and usage patterns to ensure cost-effectiveness carefully.
Learning curve:- While Instana simplifies the instrumentation process, mastering the platform and utilizing its advanced features may require a learning curve. Users must invest time understanding the capabilities and best practices for optimal usage.
Limited on-premises support:- Instana primarily focuses on cloud-native and containerized environments, and its support for on-premises deployments may be relatively limited compared to cloud-based setups.
Customization limitations:- Although Instana offers robust out-of-the-box monitoring capabilities, it may have limitations in terms of customization. Advanced users who require extensive customization options may find the platform somewhat restrictive.
Instana offers automatic instrumentation, end-to-end visibility, and AI-driven analysis, making it a powerful APM solution.
However, organizations should consider factors such as pricing complexity, learning curve, and customization limitations before adopting Instana for their monitoring needs.
Customer Ratings:-
Trust Radius: Score 9 out of 10 (10+ reviews)
G2: 4.5/5 (350+ reviews)
Dynatrace vs Instana:-
When comparing Dynatrace and Instana, two prominent players in the application performance monitoring (APM) market, it’s important to consider their unique strengths and capabilities.
Dynatrace is known for its comprehensive monitoring capabilities across complex environments. It offers AI-powered automation, providing deep insights into application performance and facilitating real-time issue detection and resolution.
Dynatrace’s deep transactional visibility and synthetic monitoring capabilities make it a powerful tool for identifying and addressing performance bottlenecks.
On the other hand, Instana specializes in monitoring applications and microservices in dynamic and cloud-native environments.
Its automatic instrumentation and distributed tracing capabilities enable organizations to gain granular insights into the performance of individual components and track requests across the microservices architecture.
Dynatrace excels in handling large-scale deployments and offers extensive scalability options. It provides comprehensive visibility into the entire technology stack, including applications, infrastructure, and user experiences.
Instana, on the other hand, offers end-to-end visibility into modern architectures, focusing on automatic discovery and AI-driven monitoring.
Here’s a comparison table outlining the key features and capabilities of Dynatrace and Instana:-
| Feature | Dynatrace | Instana |
|---|---|---|
| Monitoring Approach | Full-stack observability | AIOps-based monitoring |
| Supported Platforms | Wide range including cloud, containers, and more | Cloud-native and containerized environments |
| Automatic Discovery | Yes, dynamic and automatic discovery of services and dependencies | Yes, automatic detection of services and dependencies |
| Real-time Monitoring | Yes, real-time monitoring and alerting | Yes, real-time monitoring and alerting |
| Distributed Tracing | Yes, provides end-to-end transaction tracing | Yes, supports distributed tracing |
| Application Insights | Deep insights into applications and dependencies | Deep insights into applications and dependencies |
| AI and Machine Learning | Advanced AI and ML capabilities for anomaly detection and root cause analysis | Utilizes AI and ML for anomaly detection and root cause analysis |
| Infrastructure Monitoring | Yes, comprehensive infrastructure monitoring | Yes, infrastructure monitoring |
| Cloud and Container Monitoring | Yes, native support for cloud and container platforms | Focuses on cloud-native and containerized environments |
| User Experience Monitoring | Provides user experience monitoring, including synthetic monitoring and real user monitoring | Offers user experience monitoring, including synthetic monitoring and real user monitoring |
| Integration Ecosystem | Extensive integration ecosystem with various tools and platforms | Offers integrations with popular tools and platforms |
| Scalability | Highly scalable, designed for enterprise-level deployments | Scalable, suitable for small to large deployments |
| Pricing | Subscription-based pricing model | Subscription-based pricing model |
| Customer Support | 24/7 customer support and dedicated technical account managers | 24/7 customer support and technical assistance |
3. New Relic
As organizations seek Dynatrace alternatives, New Relic emerges as a compelling application performance monitoring (APM) solution.
With its extensive feature set and robust capabilities, New Relic offers businesses a powerful platform to monitor and optimize their application performance.
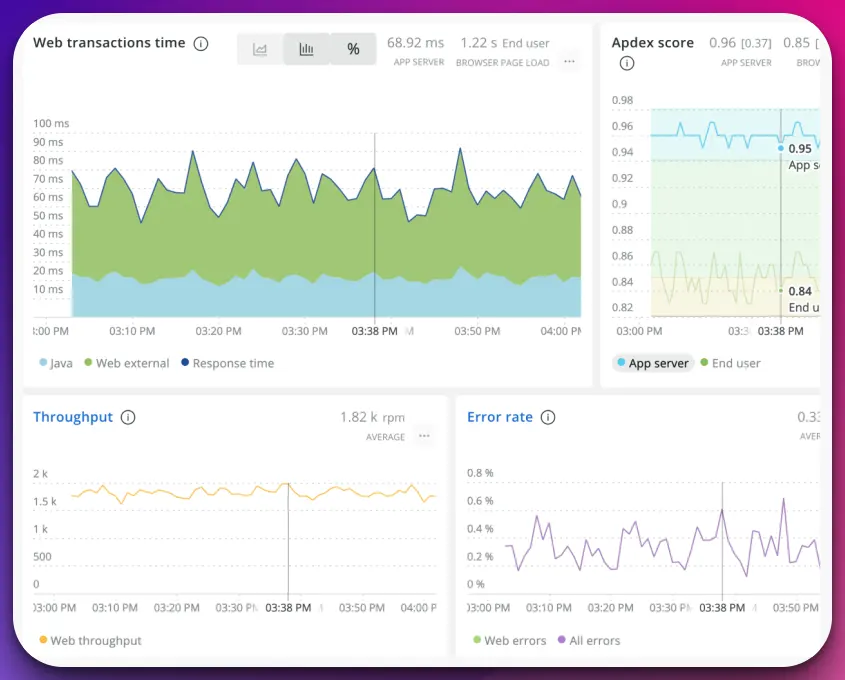
New Relic excels in its comprehensive monitoring capabilities across different technology stack layers, including applications, infrastructure, and user experiences.
By capturing and correlating data from various sources, New Relic provides organizations with a holistic view of their application performance, enabling them to identify and resolve issues proactively.
One of New Relic’s notable strengths is its business transaction monitoring feature.
This capability allows organizations to track critical transactions within their applications and gain insights into performance metrics such as response times, throughput, and errors.
By monitoring these transactions, businesses can identify performance bottlenecks and optimize their applications accordingly.
Moreover, New Relic offers code-level visibility and deep-dive diagnostics, enabling developers to pinpoint and troubleshoot issues down to the line of code.
This granular visibility empowers organizations to optimize application performance and deliver exceptional user experiences.
New Relic’s user-friendly interface, extensive integrations, and proactive alerting further enhance its appeal as a Dynatrace alternative.
It provides businesses the tools to monitor, analyze, and optimize application performance, ensuring optimal user experiences and driving business success.

Pros:-
End-to-end visibility:- New Relic offers extensive end-to-end visibility into application performance, allowing organizations to monitor and analyze the entire application stack. This includes code-level visibility, transaction tracing, and infrastructure monitoring, enabling quick identification of bottlenecks.
Easy implementation:- New Relic provides straightforward implementation processes, easy-to-follow guides, and documentation. It offers agent-based monitoring for various programming languages, simplifying the instrumentation process.
Powerful analytics:- New Relic’s capabilities enable deep insights into application behavior and user experience. It offers advanced features like anomaly detection, real-time analytics, and customizable dashboards, empowering teams to make data-driven decisions.
Scalability:- New Relic is designed to handle large-scale deployments. It can efficiently monitor distributed systems and automatically scale to accommodate increasing data volumes.
Cons:-
Cost:- New Relic can be expensive, especially for small or budget-constrained organizations. Pricing is typically based on data volume, host count, and additional features, which can lead to higher costs as the scale increases.
Learning curve:- While New Relic offers extensive features, mastering the platform may require a learning curve. Users need to invest time in understanding its capabilities and utilizing them effectively.
Customization limitations:- New Relic provides a robust set of features out-of-the-box, but customization options may be limited. Advanced users requiring extensive customization for unique monitoring needs may have limitations.
Alert management:- Managing and fine-tuning alerts in New Relic can be challenging, especially when dealing with complex alert configurations and large-scale environments.
Customer Ratings:-
Trust Radius: Score 8.6 out of 10 (280+ reviews)
Capterra: 4.5/5 (167+ reviews)
G2: 4.3/5 (372+ reviews)
Dynatrace vs New Relic:-
When comparing Dynatrace and New Relic, two prominent application performance monitoring (APM) solutions, examining their unique features and capabilities is essential.
Dynatrace is renowned for its AI-powered automation and comprehensive monitoring capabilities.
It provides end-to-end visibility into applications, infrastructure, and user experiences, allowing organizations to detect and resolve performance issues precisely.
Dynatrace’s deep transactional visibility and synthetic monitoring features make it a powerful tool for identifying and optimizing application performance.
On the other hand, New Relic offers a comprehensive approach to APM. It excels in monitoring applications, infrastructure, and user experiences across the technology stack.
New Relic’s strength lies in its business transaction monitoring feature, which enables organizations to track critical transactions and gain insights into performance metrics.
While Dynatrace provides advanced code-level visibility and deep-dive diagnostics, New Relic offers a user-friendly interface and extensive integrations, making it accessible to many users.
Both solutions provide proactive alerting and reporting capabilities to ensure organizations can take proactive measures to maintain optimal application performance.
Here’s a comparison table highlighting the key features and capabilities of Dynatrace and New Relic:-
| Features | Dynatrace | New Relic |
|---|---|---|
| Monitoring | Full-stack observability and monitoring | Application and infrastructure monitoring |
| AIOps | AI-powered automation and problem detection | Basic alerting and anomaly detection |
| Distributed Tracing | End-to-end transaction monitoring | Limited distributed tracing capabilities |
| Cloud Integration | Comprehensive cloud platform support | Support for major cloud providers |
| User Experience | Real user monitoring and session replay | Real user monitoring |
| Analytics | Advanced analytics and root cause analysis | Basic analytics and reporting |
| Application Performance | Deep code-level insights and performance data | Code-level performance insights |
| Scalability | Auto-scaling and dynamic infrastructure support | Scalable infrastructure monitoring |
| Containerization | Full container visibility and monitoring | Container monitoring |
| Cost | Higher cost, enterprise-focused pricing | Lower cost, flexible pricing options |
| Integration | Extensive third-party integrations | Limited third-party integrations |
4. SigNoz
Regarding observability solutions, SigNoz emerges as a compelling open-source alternative to Dynatrace.
With its unique features and robust capabilities, SigNoz is reshaping the application monitoring and troubleshooting landscape.
SigNoz, as an open-source platform, provides organizations with the flexibility and freedom to customize and tailor observability to their specific needs.
By leveraging the power of the community, SigNoz encourages collaboration and fosters innovation in the realm of monitoring and tracing.
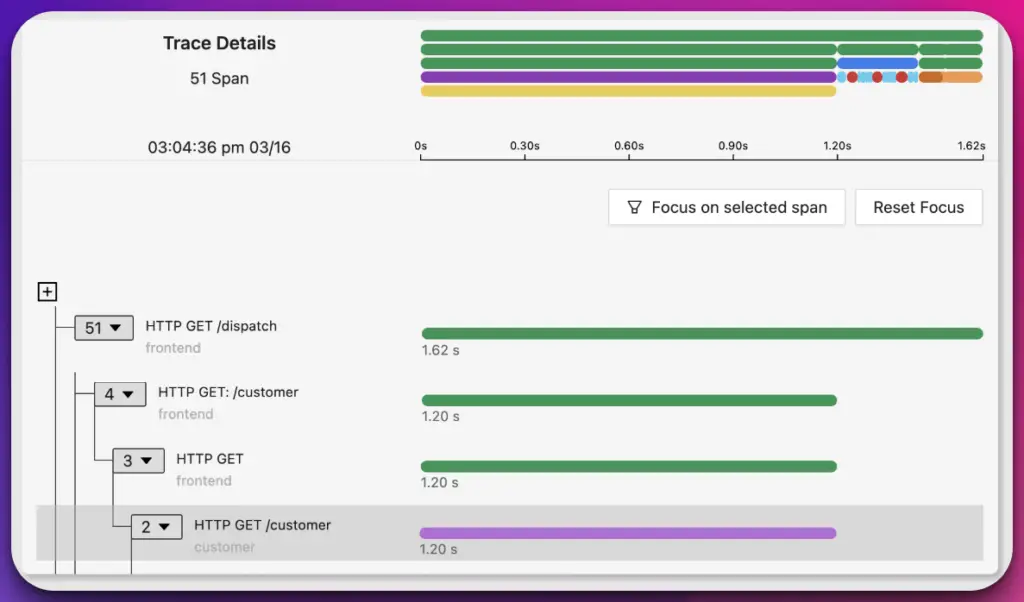
As a Dynatrace alternative, SigNoz offers a comprehensive suite of tools and functionalities. Its advanced tracing capabilities enable end-to-end visibility into complex microservices architectures, empowering teams to analyze the flow of requests across the entire system.
One of the key advantages of SigNoz as an alternative is its cost-effectiveness. Being open source, SigNoz eliminates the licensing fees associated with proprietary solutions like Dynatrace, making it an attractive option for organizations with budget constraints.
SigNoz’s user-friendly interface and intuitive dashboards provide clear and concise metrics and insights, allowing teams to monitor the performance of their applications in real time.
Its support for various data sources and integrations further enhances its versatility and adaptability in different environments.
In conclusion, SigNoz presents itself as a compelling open-source alternative to Dynatrace.
With its rich feature set, advanced tracing capabilities, and cost-effectiveness, SigNoz empowers organizations to achieve comprehensive observability and effectively monitor their applications without the constraints of proprietary licensing.

5. Stackify Retrace
As organizations explore Dynatrace alternatives, one noteworthy option is Stackify Retrace.
This application performance monitoring (APM) solution offers unique features and capabilities that make it a compelling choice for businesses seeking to monitor and optimize their applications.
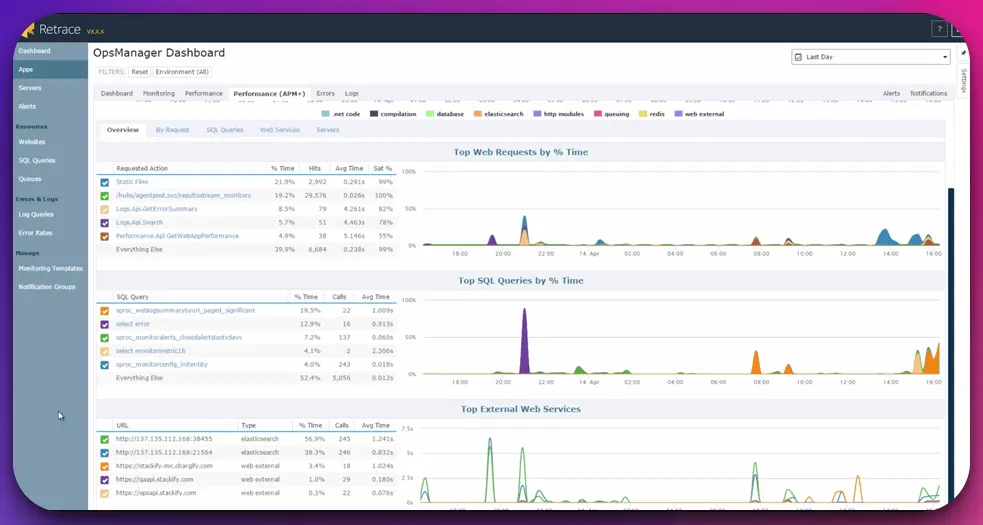
Stackify Retrace stands out with its focus on code-level visibility and application performance profiling.
It gives developers deep insights into their application code, allowing them to identify performance bottlenecks, trace issues, and optimize their applications for improved performance.
Another key strength of Stackify Retrace is its real-time monitoring capabilities.
It enables organizations to monitor critical metrics such as real-time response times, errors, and resource utilization, empowering them to quickly detect and address any anomalies or issues.
Moreover, Stackify Retrace offers a comprehensive suite of features, including log management, error tracking, and application metrics, providing businesses with a holistic view of their application health.
One of the notable advantages of Stackify Retrace as a Dynatrace alternative is its affordability. With flexible pricing options and transparent cost structures, Stackify Retrace makes it accessible to businesses of all sizes.
Overall, Stackify Retrace is a compelling alternative to Dynatrace, offering code-level visibility, real-time monitoring, and a comprehensive feature set at an affordable price point.
Organizations can leverage Stackify Retrace to optimize their application performance and deliver exceptional user experiences.
Customer Ratings:-
Trust Radius: Score 8 out of 10 (6+ reviews)
Capterra: 4.3/5 (77+ reviews)
G2: 4.2/5 (56+ reviews)
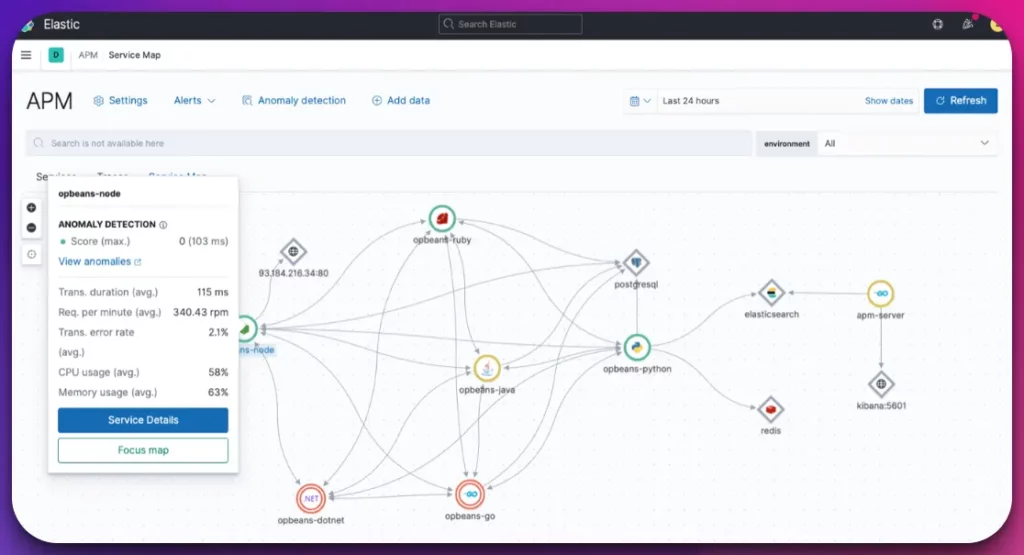
6. Elastic APM
When seeking Dynatrace alternatives, Elastic APM stands out as a compelling choice for businesses needing a robust application performance monitoring (APM) solution.
Developed by Elastic, Elastic APM offers a range of features and capabilities that make it a viable option for organizations striving to optimize their application performance.
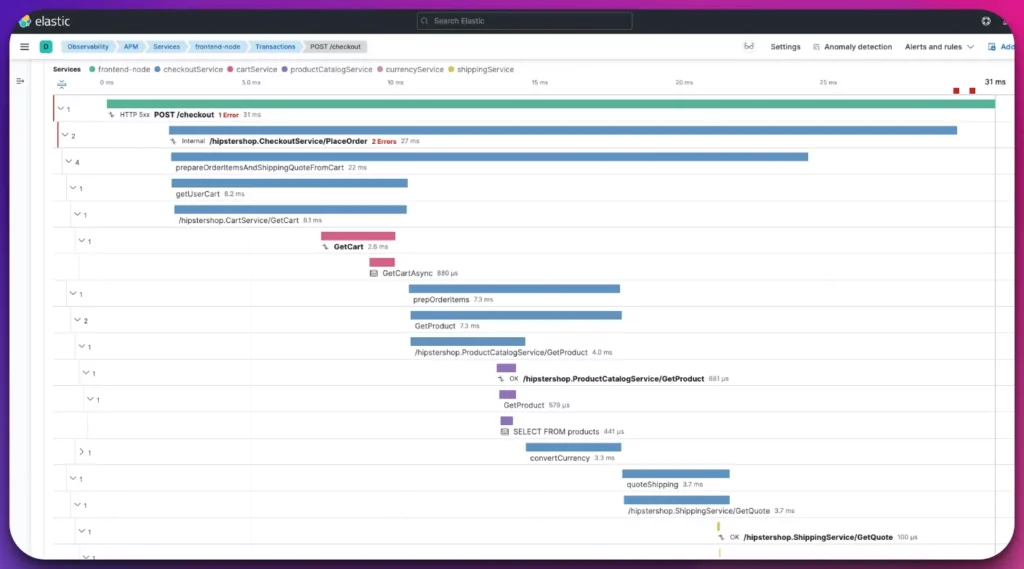
Elastic APM provides deep visibility into the performance of applications, enabling businesses to identify and resolve issues with precision.
With its distributed tracing capabilities, Elastic APM allows organizations to trace requests across different services and gain insights into the entire application stack.
As an integral part of the Elastic Stack, Elastic APM seamlessly integrates with other components like Elasticsearch and Kibana, forming a comprehensive observability platform.
This integration enables organizations to analyze performance data alongside logs and metrics, gaining a holistic view of their applications’ health.
With Elastic APM, businesses can monitor and analyze key real-time metrics such as response times, throughput, and error rates.
The platform also supports various programming languages and frameworks, ensuring compatibility with diverse technology stacks.
As a scalable solution, Elastic APM can handle high volumes of data and adapt to dynamic environments.
Its customizable dashboards and alerting mechanisms empower organizations to proactively identify and address performance issues, ensuring optimal application performance and user experience.
In summary, Elastic APM offers a strong alternative to Dynatrace with its deep visibility, distributed tracing, integration with the Elastic Stack, and scalability.
Businesses can rely on Elastic APM to monitor, analyze, and optimize their application performance, ultimately driving better user satisfaction and business outcomes.
Customer Ratings:-
Trust Radius: Score 8.8 out of 10 (9+ reviews)
G2: 3.9/5 (6+ reviews)
7. SolarWinds APM
SolarWinds APM is a strong contender among Dynatrace alternatives in application performance monitoring (APM).
With its comprehensive features and capabilities, SolarWinds APM offers businesses a powerful platform to monitor and optimize their application performance.
SolarWinds APM provides end-to-end visibility into the entire application stack, allowing organizations to gain insights into the performance of their applications, databases, servers, and networks.
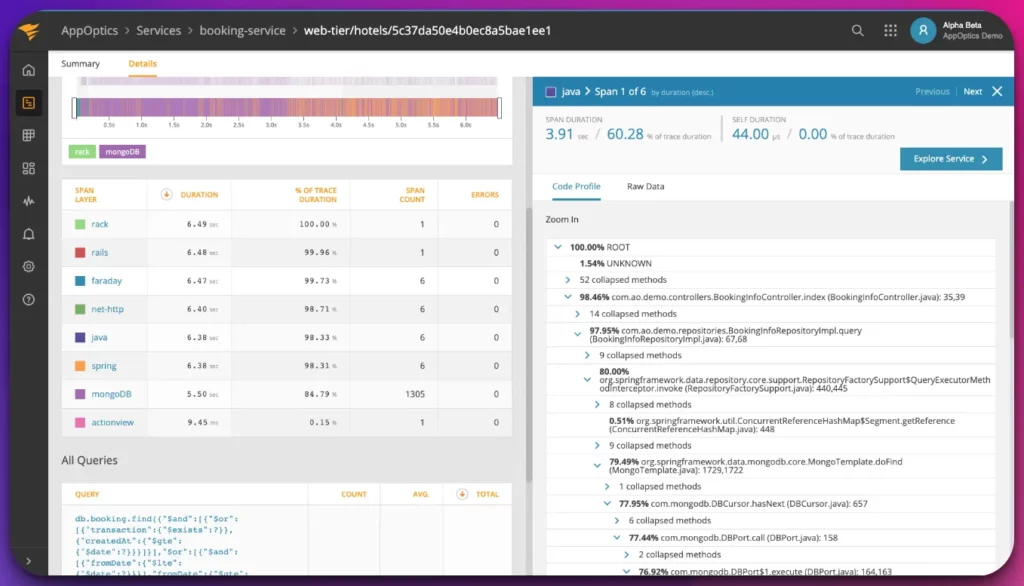
This comprehensive monitoring enables businesses to identify performance bottlenecks and proactively address issues.
One of the key strengths of SolarWinds APM is its transaction tracing capability, which allows organizations to track individual transactions and analyze their performance across various components.
Businesses can optimize their applications and ensure a seamless user experience by pinpointing performance issues at a granular level.
SolarWinds APM offers real-time monitoring and alerting capabilities, enabling organizations to promptly identify and respond to performance anomalies.
With customizable dashboards and reports, businesses can gain actionable insights into their application performance and make informed decisions.
Additionally, SolarWinds APM provides deep-dive diagnostics, allowing developers to drill down into code-level details and troubleshoot issues efficiently.
This visibility into the application code helps optimize performance and streamline operations.
SolarWinds APM is a compelling alternative to Dynatrace, offering end-to-end visibility, transaction tracing, real-time monitoring, and deep-dive diagnostics.
Businesses can rely on SolarWinds APM to monitor and optimize their application performance, ensuring optimal user experiences and driving business success.
Customer Ratings:-
Trust Radius: Score 8.3 out of 10 (641+ reviews)
G2: 4.3/5 (260+ reviews)
8. AppDynamics
When seeking Dynatrace alternatives, AppDynamics emerges as a robust choice in application performance monitoring (APM).
With its advanced features and comprehensive monitoring capabilities, AppDynamics provides businesses with a powerful platform to monitor and optimize their application performance.
AppDynamics excels in its deep code-level visibility and transaction tracing capabilities, allowing organizations to gain granular insights into the performance of their applications.
This level of visibility enables businesses to identify and address performance bottlenecks with pinpoint accuracy.
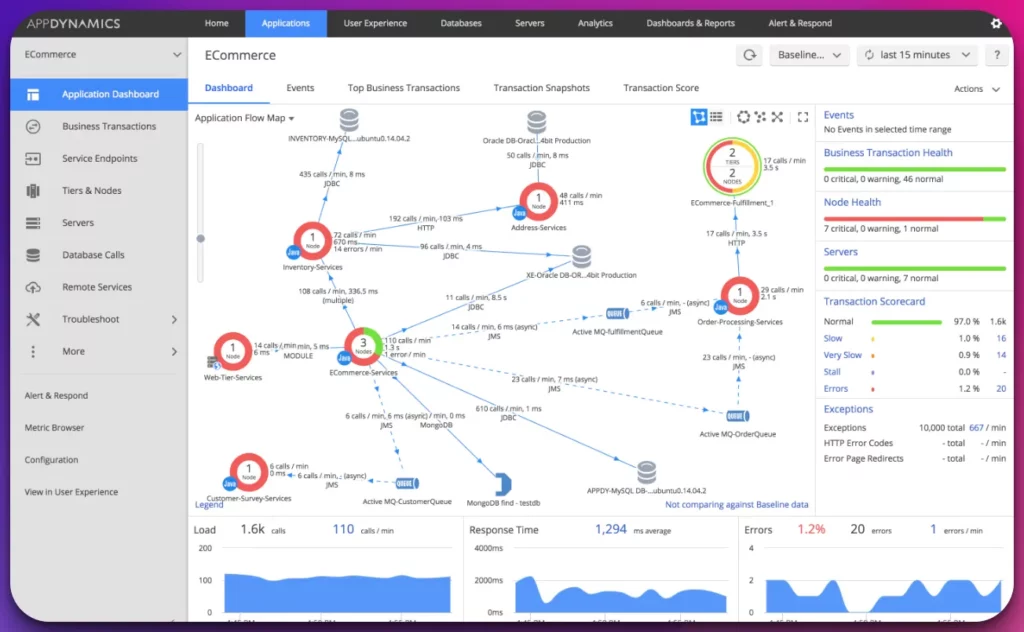
Moreover, AppDynamics offers real-time monitoring and analytics, enabling businesses to detect and resolve performance issues proactively.
Its AI-powered anomaly detection and predictive capabilities help organizations identify potential issues before they impact end users, ensuring a seamless user experience.
AppDynamics also provides business transaction monitoring and end-user experience monitoring, allowing organizations to understand the impact of performance on their customers.
Businesses can make data-driven decisions to improve customer satisfaction by tracking critical transactions and user interactions.
Additionally, AppDynamics supports a wide range of technologies and environments, making it suitable for complex and distributed application architectures. Its scalability and flexibility ensure it can handle large-scale deployments and dynamic environments.
As a Dynatrace alternative, AppDynamics offers deep code-level visibility, transaction tracing, real-time monitoring, and analytics.
It empowers businesses to optimize their application performance, deliver exceptional user experiences, and drive business success.
Pros:-
Comprehensive monitoring:- AppDynamics provides comprehensive monitoring capabilities, offering visibility into application performance, user experience, and infrastructure health. It allows organizations to identify and resolve performance issues quickly.
Deep dive diagnostics:- AppDynamics offers advanced diagnostic tools, including transaction tracing and code-level visibility. These capabilities help pinpoint performance bottlenecks, optimize code, and enhance application performance.
Real-time analytics:- AppDynamics excels in real-time analytics, providing actionable insights into application behavior and performance trends. It offers powerful dashboards, analytics, and reporting features that enable teams to make data-driven decisions.
Scalability:- AppDynamics is designed to handle large-scale environments, making it suitable for enterprise-level deployments. It can monitor complex, distributed architectures and dynamically scale to accommodate growing demands.
Cons:-
Complex setup:- AppDynamics can have a complex initial setup, especially for organizations with intricate application architectures. Configuring agents, instrumenting code, and integrating various technologies may require technical expertise.
Pricing:- AppDynamics is considered a premium APM solution, and the pricing structure may be a limiting factor for small or budget-constrained organizations. It often involves tiered pricing based on application size, infrastructure components, and additional features.
Learning curve:- Mastering the full capabilities of AppDynamics may require a learning curve. The platform offers extensive features, and users must invest time and effort to utilize them effectively.
Limited support for legacy systems:- AppDynamics primarily focuses on modern, cloud-native applications, which may result in limited support for legacy systems or technologies.
AppDynamics offers comprehensive monitoring, deep diagnostics, real-time analytics, and scalability for effective application performance management.
While it requires careful consideration of setup complexity, pricing, and learning curve, organizations prioritizing performance optimization and real-time insights will find AppDynamics a valuable addition to their monitoring toolkit.
Customer Ratings:-
Trust Radius: Score 8.3 out of 10 (162+ reviews)
G2: 4.3/5 (367+ reviews)
Dynatrace vs Appdynamics:-
Dynatrace is known for its comprehensive APM capabilities, providing end-to-end visibility into applications, infrastructure, and user experiences.
Its AI-powered automation allows for real-time issue detection and resolution. Dynatrace’s deep transactional visibility and synthetic monitoring features make it a powerful tool for identifying and optimizing application performance.
On the other hand, AppDynamics excels in deep code-level visibility and transaction tracing. It offers granular insights into application performance, allowing organizations to pinpoint performance bottlenecks precisely.
AppDynamics’ real-time monitoring and analytics capabilities enable proactive issue detection and resolution.
Dynatrace is known for its scalability, making it suitable for large-scale deployments and complex environments. AppDynamics, on the other hand, offers a wide range of technologies and environment support, making it suitable for distributed application architectures.
Dynatrace and AppDynamics provide organizations with the tools to monitor and optimize application performance.
The choice between the two depends on specific business requirements, the complexity of the environment, and the desired level of automation.
Here’s a table comparing Dynatrace and AppDynamics based on their features and capabilities:-
| Feature | Dynatrace | AppDynamics |
|---|---|---|
| APM Capabilities | Provides end-to-end application performance monitoring | Offers comprehensive application performance monitoring |
| Cloud Monitoring | Supports monitoring of cloud-native applications and infrastructure | Offers cloud monitoring capabilities |
| Synthetic Monitoring | Includes synthetic monitoring for simulating user interactions | Offers synthetic monitoring for testing application performance |
| Real User Monitoring | Provides real-time monitoring of user experience and behavior | Offers real-time monitoring of user experience |
| Root Cause Analysis | Uses AI-powered analysis to identify and resolve issues quickly | Provides root cause analysis for faster troubleshooting |
| Auto-Baselining | Automatically detects normal performance baselines for applications | Offers automatic baseline detection for performance metrics |
| Business Analytics | Provides business-oriented analytics and reporting capabilities | Offers business analytics features for performance insights |
| Integration | Integrates with various tools and technologies for end-to-end monitoring | Integrates with multiple platforms and third-party tools |
| Deployment Options | Available as SaaS or on-premises deployment options | Provides both SaaS and on-premises deployment options |
| Scalability | Designed to handle large-scale deployments and high traffic loads | Supports scalability for enterprise-level applications |
| Pricing | Offers tiered pricing plans based on features and usage | Provides customized pricing based on specific requirements |
| Customer Support | Provides 24/7 customer support and dedicated account management | Offers customer support and technical assistance |
Pros and Cons of Dynatrace
Pros:-
Comprehensive Monitoring:- Dynatrace provides end-to-end visibility into applications, infrastructure, and user experiences, allowing businesses a holistic view of their performance.
AI-Powered Automation:- The AI-driven automation capabilities of Dynatrace enable organizations to detect and resolve performance issues in real-time, ensuring proactive management.
Deep Transactional Visibility:- Dynatrace offers code-level visibility and distributed tracing, allowing businesses to pinpoint performance bottlenecks and optimize their applications precisely.
Scalability:- Dynatrace can handle large-scale deployments and complex environments, making it suitable for enterprises with demanding monitoring needs.
Cons:-
Cost:- Dynatrace’s advanced capabilities and comprehensive feature set often come at a higher price point, which may be a consideration for organizations with budget constraints.
Complexity:- The extensive capabilities of Dynatrace can also lead to a steep learning curve for users, requiring time and resources for proper implementation and utilization.
Dependency on Dynatrace Platform:- As a proprietary solution, organizations using Dynatrace may face a level of vendor lock-in and limited flexibility compared to open-source alternatives.
Customization:- While Dynatrace provides a range of features, some businesses may require more specific customization options that may not be as readily available.
Dynatrace vs Grafana
When comparing Dynatrace and Grafana, two prominent solutions in monitoring and visualization, it’s important to consider their unique features and use cases.
Dynatrace is renowned for its comprehensive application performance monitoring (APM) capabilities.
It offers end-to-end visibility into applications, infrastructure, and user experiences, using AI-driven automation to detect and resolve real-time performance issues.
Dynatrace’s deep transactional visibility and synthetic monitoring features make it a powerful tool for identifying and optimizing application performance.
On the other hand, Grafana is a leading open-source platform for metric visualization and monitoring analytics. It excels in its ability to collect and visualize data from various sources, including databases, cloud services, and APM tools.
Grafana’s customizable dashboards, extensive plugin ecosystem, and support for multiple data sources make it a preferred choice for creating rich visualizations and actionable insights.
While Dynatrace focuses primarily on APM, Grafana provides a more general-purpose monitoring and visualization solution.
Organizations often use Grafana with other monitoring tools, including Dynatrace, to consolidate and visualize data from multiple sources in a unified manner.
Ultimately, the choice between Dynatrace and Grafana depends on specific business needs. Dynatrace’s deep monitoring capabilities may be the preferred option if a comprehensive APM solution is required.
However, Grafana’s open-source nature and versatile capabilities make it a compelling choice if it focuses on flexible data visualization and analytics across various data sources.
| Criteria | Dynatrace | Grafana |
|---|---|---|
| Monitoring | Comprehensive application performance monitoring | General-purpose metric visualization and monitoring |
| Visualization | Built-in visualizations and dashboards | Highly customizable and flexible dashboards |
| Data Sources | Focuses on application and infrastructure data | Supports multiple data sources and integrations |
| Automation | AI-driven automation for real-time issue detection and resolution | Limited automation capabilities |
| Scalability | Capable of handling large-scale deployments | Highly scalable and suitable for diverse environments |
| Pricing Model | Commercial software with subscription-based pricing | Open-source with community and enterprise editions |
| Use Cases | Ideal for in-depth application performance monitoring and troubleshooting | Suitable for creating rich visualizations and analytics across various data sources |
| Learning Curve | Steep learning curve due to extensive capabilities | Relatively easier to get started with customizable options |
| Vendor Lock-in | Proprietary solution with potential vendor lock-in | Open-source nature allows more flexibility |
Dynatrace vs Splunk
If optimizing application performance and monitoring user experience is paramount, Dynatrace would be an excellent fit.
Conversely, if you require a robust data analytics and log management platform to unlock insights from diverse data sources, Splunk would be the recommended choice.
Here’s a table comparing Dynatrace and Splunk:-
| Feature | Dynatrace | Splunk |
|---|---|---|
| Focus | Application Performance Monitoring (APM) | Data Analytics and Log Management |
| Key Strengths | End-to-end visibility into application performance | Analysis of machine-generated data and log management |
| Monitoring Scope | Monitors application and infrastructure performance | Ingests and analyzes diverse data sources including logs and metrics |
| AI-Powered Insights | Utilizes AI-driven analysis for anomaly detection and troubleshooting | Offers powerful search capabilities and data correlation |
| User Experience | Monitors and optimizes user experience | Does not directly focus on user experience monitoring |
| Data Collection | Captures performance metrics and traces | Ingests and analyzes logs, metrics, and events |
| Integrations | Integrates with various tools and technologies for end-to-end monitoring | Extensive library of plugins and integrations |
| Deployment Options | Available as SaaS or on-premises deployment options | Provides both SaaS and on-premises deployment options |
| Scalability | Designed to handle large-scale deployments and high traffic loads | Scalable for processing large volumes of data |
| Pricing | Offers tiered pricing plans based on features and usage | Provides customized pricing based on specific requirements |
| Customer Support | Provides 24/7 customer support and dedicated account management | Offers customer support and technical assistance |
Dynatrace vs Prometheus
Dynatrace is a comprehensive, all-in-one observability solution that combines AI-powered monitoring, full-stack visibility, and cloud-native capabilities.
With its sophisticated auto-discovery and automatic baselining features, Dynatrace excels at providing deep insights into the end-to-end performance of complex applications.
Its smart analytics engine and intelligent root cause analysis empower users to identify and resolve performance bottlenecks quickly.
On the other hand, Prometheus is an open-source monitoring and alerting toolkit primarily focused on time-series data collection and analysis.
It is known for its flexibility and scalability, making it a popular choice for cloud-native environments. Prometheus relies on a pull-based approach, where agents scrape metrics from various targets.
It’s powerful query language and alerting system allow users to create highly customizable monitoring workflows.
While Dynatrace offers an all-inclusive, out-of-the-box solution, Prometheus requires more configuration and integration to achieve similar functionality.
However, Prometheus provides greater flexibility and customizability, making it ideal for organizations with specific monitoring requirements or existing infrastructure.
In conclusion, the choice between Dynatrace and Prometheus depends on an organization’s specific needs and preferences.
Dynatrace excels in providing a comprehensive, AI-driven observability solution, while Prometheus offers more flexibility and control over monitoring workflows.
📗FAQ’s
What Are Dynatrace Alternatives?
Dynatrace is a popular application performance monitoring (APM) tool, but it’s essential to explore alternatives to determine the best fit for your specific needs.
Some notable Dynatrace alternatives include New Relic, AppDynamics, Datadog, and Splunk.
These alternatives offer similar functionalities, such as real-time monitoring, performance analysis, and deep insights into application performance. Evaluating these options based on your requirements will help you make an informed decision.
Which Is Better: Dynatrace or Datadog?
The choice between Dynatrace and Datadog depends on your specific use case and priorities. Both tools offer robust monitoring capabilities but with different approaches.
Dynatrace focuses on AI-powered automation, providing intelligent insights and root cause analysis. Datadog, on the other hand, offers a broader range of monitoring services, including infrastructure, logs, and security.
Evaluating the strengths and weaknesses of each tool based on your requirements will help determine which is better suited for your organization.
What Is the Difference Between Dynatrace and Splunk?
Dynatrace and Splunk are both powerful tools but serve different purposes. Dynatrace is an APM tool that monitors application performance, providing deep insights into application behavior and end-user experience.
In contrast, Splunk is a comprehensive data analytics and log management platform that allows organizations to collect, index, and analyze machine-generated data.
While Dynatrace focuses on application monitoring, Splunk offers a broader scope of data analysis and insights across various systems and platforms.
What Is the Difference Between Dynatrace and Grafana?
Dynatrace and Grafana serve different purposes within the monitoring landscape. Dynatrace is an APM tool that monitors application performance and provides comprehensive insights into application behavior.
Grafana, on the other hand, is a data visualization and analytics platform that integrates with various data sources, including monitoring tools like Dynatrace.
Grafana enables organizations to create custom dashboards and visualize data from different sources, including Dynatrace, in a unified and visually appealing manner.
What Is the Difference Between Dynatrace and Prometheus?
Dynatrace and Prometheus are monitoring tools but differ in approach and functionality. Dynatrace is a commercial APM tool that provides automated, AI-powered monitoring and root cause analysis for applications.
On the other hand, Prometheus is an open-source monitoring and alerting toolkit that focuses on time-series data collection and analysis.
While Dynatrace offers a comprehensive suite of monitoring capabilities, Prometheus is highly customizable and allows users to build their monitoring solutions using its flexible architecture.
Is Splunk Better Than Dynatrace?
Whether Splunk is better than Dynatrace depends on your specific requirements and priorities.
Splunk is a versatile data analytics and log management platform, whereas Dynatrace is an APM tool focused on application performance monitoring.
Splunk excels in analyzing machine-generated data from various sources, while Dynatrace provides comprehensive insights into application behavior and end-user experience.
Evaluating the strengths and weaknesses of each tool based on your use case will help you make an informed decision.
Which Is Better: AppDynamics vs Dynatrace?
Choosing between AppDynamics and Dynatrace depends on your specific requirements and priorities. Both tools offer robust APM capabilities, but they have different approaches.
AppDynamics emphasizes application-centric monitoring and deep code-level diagnostics. Dynatrace, on the other hand, leverages AI-powered automation and provides advanced analytics for application performance management.
Evaluating the strengths and weaknesses of each tool based on your use case will help determine which is better suited for your organization.
Is Dynatrace a DevOps Tool?
Dynatrace is not solely a DevOps tool but a comprehensive APM solution that plays a vital role in DevOps practices.
Dynatrace provides insights into application performance and user experience, facilitating proactive monitoring, rapid troubleshooting, and collaboration between development and operations teams.
It’s automation capabilities and integration with popular DevOps tools make it a valuable asset in a DevOps environment.
Is Dynatrace an AWS?
No, Dynatrace is not an AWS (Amazon Web Services) itself. However, Dynatrace can monitor and provide insights into applications and infrastructure hosted on AWS.
It integrates seamlessly with AWS services, allowing organizations to monitor and optimize the performance of their AWS-hosted applications and infrastructure.
Can Grafana Replace Splunk?
Grafana and Splunk serve different purposes, and while Grafana is a powerful data visualization and analytics platform, it cannot fully replace the comprehensive capabilities of Splunk.
Splunk’s strength lies in its ability to ingest, analyze, and manage vast amounts of machine-generated data from various sources. Grafana, on the other hand, focuses on data visualization and offers integrations with multiple data sources, including Splunk.
Depending on your requirements, Grafana can complement Splunk by providing customized dashboards and visualizations for your data.
Why Grafana Is So Popular?
Grafana’s popularity stems from its user-friendly interface, extensibility, and wide-ranging integration capabilities.
It allows users to create visually appealing and interactive dashboards for monitoring and visualizing data from various sources, including databases, cloud services, and monitoring tools.
Grafana’s open-source nature and active community support have contributed to its popularity, making it a go-to choice for organizations seeking flexible and customizable data visualization solutions.
Is Dynatrace Worth It?
Whether Dynatrace is worth depends on your organization’s specific needs and priorities. Dynatrace offers advanced monitoring and observability capabilities, including AI-driven insights, root cause analysis, and cloud-native monitoring.
Its comprehensive features and automation capabilities can provide significant value, particularly for complex application environments.
Evaluating its benefits in improved performance, efficiency, and troubleshooting can help assess whether Dynatrace is worth the investment for your organization.
What Is the Difference Between Elasticsearch and Dynatrace?
Elasticsearch and Dynatrace serve different purposes within the monitoring landscape. Elasticsearch is a highly scalable and distributed search and analytics engine primarily used for log and data indexing and searching.
On the other hand, Dynatrace is an APM tool that focuses on monitoring and analyzing the performance and behavior of applications.
While Elasticsearch can be integrated with Dynatrace to store and search log data, Dynatrace offers a broader range of monitoring and analysis capabilities beyond log management.
Does Dynatrace Use AI?
Dynatrace incorporates AI (Artificial Intelligence) and machine learning capabilities to automate and enhance various application monitoring and performance management aspects.
Dynatrace’s AI engine, Davis, analyzes vast amounts of data, detects anomalies, and provides intelligent insights and root cause analysis to help organizations quickly identify and resolve performance issues.
Why Use Dynatrace?
Using Dynatrace offers several benefits for organizations. It provides comprehensive monitoring and observability capabilities, including real-time insights into application performance, end-user experience, and infrastructure health.
Dynatrace’s automation and AI-powered features help detect anomalies, reduce manual efforts, and enable proactive performance management.
Dynatrace’s cloud-native approach also ensures compatibility with modern architectures and technologies, making it a valuable tool for organizations seeking to optimize their application performance and ensure a superior user experience.
Why Not Use Splunk?
While Splunk is a powerful data analytics and log management platform, there may be scenarios where it may not be the ideal choice.
Splunk’s licensing costs can be high, especially for organizations with large amounts of data to analyze. Additionally, managing and scaling Splunk deployments can be complex and resource-intensive.
Organizations with limited resources or those with simpler data analysis needs may find alternative solutions that are more cost-effective and easier to manage.
Does Dynatrace Use Selenium?
Dynatrace and Selenium serve different purposes within the software development and testing landscape.
Dynatrace focuses on monitoring and analyzing the performance and behavior of applications, providing insights into application health and end-user experience.
Selenium, on the other hand, is an open-source automation framework specifically designed for web browser testing. While Dynatrace can integrate with Selenium to provide performance insights during automated testing, they are distinct tools serving different purposes.
Why Is Splunk So Popular?
Splunk’s popularity can be attributed to its versatility and wide-ranging capabilities in analyzing and visualizing machine-generated data.
Splunk’s ability to ingest, index, and search large volumes of log and machine data from various sources has made it a go-to choice for organizations seeking comprehensive data analytics and monitoring solutions.
Splunk’s user-friendly interface, extensive ecosystem, and flexibility to customize data analysis and visualizations have contributed to its popularity across different industries and use cases.
Why Do Developers Love Dynatrace?
Developers appreciate Dynatrace for its comprehensive monitoring capabilities and AI-powered automation.
Dynatrace’s deep insights into application performance, root cause analysis, and real-time visibility enable developers to identify and resolve performance issues efficiently.
Its seamless integration with popular development and DevOps tools and its cloud-native architecture makes it ideal for developers seeking to optimize application performance and deliver exceptional user experiences.
What Language Is Dynatrace Written In?
Dynatrace’s underlying architecture and codebase are developed using various programming languages, including Java, C++, and JavaScript.
These languages enable Dynatrace to build robust and scalable monitoring solutions across diverse application environments and technology stacks.
Why Is Dynatrace So Expensive?
Several factors influence the pricing of Dynatrace. Dynatrace offers a comprehensive suite of monitoring and observability capabilities, including advanced AI-driven automation and cloud-native monitoring.
The cost of developing and maintaining such a feature-rich platform and the investment in research and development contributes to its pricing structure.
Dynatrace’s licensing model and the level of support and services provided can also impact the overall cost.
However, the investment in Dynatrace can be justified by the value it brings in terms of enhanced performance management, improved user experience, and efficient troubleshooting.
What Is the Future of Dynatrace?
The future of Dynatrace is likely to be driven by continued advancements in AI and automation, along with the evolving needs of organizations in the digital landscape.
Dynatrace will likely focus on enhancing its cloud-native capabilities, expanding its observability solutions, and further empowering organizations to optimize application performance and deliver exceptional user experiences.
Keeping pace with emerging technologies and trends, such as microservices, containers, and serverless architectures, will be crucial for Dynatrace’s future success.
Is Dynatrace a PLM Software?
No, Dynatrace is not a Product Lifecycle Management (PLM) software. Dynatrace specializes in application performance monitoring and observability, providing insights into application behavior, end-user experience, and infrastructure health.
PLM software, on the other hand, focuses on managing and optimizing product development processes, including design, manufacturing, and collaboration.
Can Dynatrace Call API?
Yes, Dynatrace provides API (Application Programming Interface) access that allows integration with various external systems and tools.
The Dynatrace API enables organizations to retrieve monitoring data, automate tasks, and integrate Dynatrace functionalities into their custom workflows and applications.
What Type of Tool Is Dynatrace?
Dynatrace is an Application Performance Monitoring (APM) tool. It focuses on monitoring and providing deep insights into applications’ performance, behavior, and user experience.
Dynatrace enables organizations to detect and resolve performance issues, optimize resource utilization, and ensure their applications’ overall health and availability.
Is Dynatrace an API?
No, Dynatrace is not an API itself. However, Dynatrace provides API access that allows developers and administrators to interact with Dynatrace functionalities programmatically.
The Dynatrace API enables automation, integration with external systems, and customization of monitoring and management workflows.
What Is Kubernetes in Dynatrace?
In the context of Dynatrace, Kubernetes is a container orchestration platform that enables organizations to deploy, scale, and manage containerized applications.
Dynatrace provides specialized monitoring and observability capabilities for Kubernetes environments, allowing organizations to gain insights into their Kubernetes-based applications’ performance, health, and resource utilization.
What Is Dynatrace in Azure?
Dynatrace in Azure refers to integrating and supporting Dynatrace’s monitoring capabilities within the Microsoft Azure cloud platform.
Dynatrace provides native integration with Azure services, allowing organizations to monitor their Azure-hosted applications, virtual machines, containers, and other resources.
Dynatrace in Azure enables comprehensive visibility into application performance, infrastructure health, and user experience within Azure environments.
Does Dynatrace Use Elasticsearch?
Dynatrace does not use Elasticsearch as its underlying data storage or search engine.
Dynatrace’s proprietary data storage and analytics architecture is designed for efficient and high-performance monitoring and analysis of application and infrastructure data.
However, Dynatrace can integrate with Elasticsearch to store and search log data for enhanced log analytics capabilities.
Who Are Competitors to Splunk?
Splunk’s competitors include data analytics and log management platforms such as Elasticsearch, LogRhythm, Sumo Logic, Graylog, and IBM QRadar.
These competitors offer similar capabilities in analyzing and managing machine-generated data, logs, and security information, providing organizations with alternatives to consider based on their specific requirements.
Which Is Better: Kibana or Grafana?
The choice between Kibana and Grafana depends on your specific needs and preferences.
Kibana and Grafana are both data visualization and analytics platforms, but their focus and supported data sources differ. Kibana is tightly integrated with Elasticsearch and primarily used for visualizing and analyzing data stored in Elasticsearch.
Grafana, on the other hand, supports a broader range of data sources, making it suitable for visualizing data from various systems and tools.
Evaluating your specific use case’s compatibility, features, and ease of use will help determine which tool is better suited for you.
What Is Microsoft Alternative to Splunk?
Microsoft’s alternative to Splunk is Azure Monitor and Azure Log Analytics. Azure Monitor provides monitoring and diagnostics capabilities for Azure resources, applications, and infrastructure.
On the other hand, Azure Log Analytics focuses on collecting, analyzing, and visualizing log and machine-generated data from various sources. These Microsoft offerings provide alternatives to Splunk for organizations leveraging the Microsoft Azure cloud platform.
What Are the Disadvantages of Grafana?
While Grafana is a powerful and widely used data visualization platform, it has some potential disadvantages. Grafana’s user interface can be complex and overwhelming for users who are not familiar with its features and configuration options.
Grafana’s native support for certain data sources may require additional plugins or configurations for full functionality. Lastly, Grafana’s learning curve can be steep for beginners who are not experienced with data visualization or querying languages.
Which Is Better: Prometheus or Grafana?
Prometheus and Grafana serve different purposes and can complement each other effectively. Prometheus is a powerful open-source monitoring and alerting toolkit focused on time-series data collection, analysis, and alerting.
Grafana, on the other hand, is a data visualization and analytics platform that integrates with various data sources, including Prometheus.
Prometheus provides the data and metrics, while Grafana allows users to create visually appealing dashboards and gain insights from the Prometheus data. The choice between the two depends on your specific monitoring and visualization needs.
What Are Problems in Dynatrace?
Like any software solution, Dynatrace may have its challenges and limitations. Some potential problems in Dynatrace include the complexity of implementation and configuration, especially in complex and distributed application environments.
Integration challenges with legacy systems or non-standard technologies may also arise. Additionally, the cost of licensing and maintenance can be a concern for organizations with limited budgets.
However, Dynatrace’s comprehensive monitoring capabilities and support can help mitigate these challenges with proper planning and deployment.
Is Dynatrace a Market Leader?
Yes, Dynatrace is considered a market leader in the Application Performance Monitoring (APM) space.
Its advanced monitoring and observability capabilities, AI-powered automation, and cloud-native approach have positioned Dynatrace as a leading provider in the industry.
Dynatrace’s focus on innovation and ability to adapt to modern application architectures and technologies contribute to its market leadership.
Is Dynatrace Real-Time Monitoring?
Yes, Dynatrace provides real-time monitoring and observability capabilities for applications and infrastructure.
Dynatrace continuously collects and analyzes performance data, providing insights into application behavior and end-user experience in near real-time.
Real-time monitoring allows organizations to proactively identify performance issues, anomalies, and bottlenecks, enabling quick response and resolution.
Is Elasticsearch Better Than Splunk?
Comparing Elasticsearch and Splunk depends on specific use cases and requirements. Elasticsearch is an open-source distributed search and analytics engine that excels in handling large volumes of log and time-series data, providing fast search capabilities and scalability.
On the other hand, Splunk is a comprehensive data analytics and log management platform with advanced data analysis and visualization features. The choice between the two will depend on scalability needs, budget considerations, and specific data analysis requirements.
Is Kafka Similar to Elasticsearch?
Kafka and Elasticsearch serve different purposes within the data processing and analytics landscape.
Kafka is a distributed streaming platform that handles real-time data streams and facilitates event-driven architectures.
Elasticsearch, on the other hand, is a search and analytics engine optimized for fast search and analysis of structured and unstructured data. While both can be components of a data processing pipeline, their functionalities and use cases differ.
Why Is Elasticsearch So Popular?
Elasticsearch’s popularity can be attributed to its scalability, speed, and versatility in handling and searching large volumes of structured and unstructured data.
Elasticsearch’s distributed architecture, full-text search capabilities, and support for complex queries have made it a go-to choice for applications requiring fast and efficient data retrieval and analysis.
Additionally, Elasticsearch’s integration with the Elastic Stack, which includes tools like Logstash and Kibana, contributes to its popularity as a comprehensive data processing and analytics solution.
Which Active Gate Is Used in Dynatrace?
Dynatrace utilizes ActiveGates as a component of its monitoring infrastructure. ActiveGates act as intermediaries between monitored entities and the Dynatrace platform, enabling the collection and transmission of monitoring data.
The specific type of ActiveGate used can vary based on the deployment scenario and the type of monitored infrastructure, such as physical hosts, virtual machines, or cloud environments.
Is Dynatrace a SaaS Product?
Yes, Dynatrace offers a Software-as-a-Service (SaaS) deployment model, allowing organizations to leverage Dynatrace’s monitoring capabilities without the need for on-premises infrastructure.
Dynatrace’s SaaS offering provides the benefits of easy deployment, scalability, and automatic updates, enabling organizations to focus on monitoring their applications rather than managing the underlying infrastructure.
Which Companies Use Dynatrace?
A wide range of companies across various industries uses Dynatrace. Some notable organizations implementing Dynatrace for application performance monitoring and observability include BMW, Adidas, SAP, Audi, T-Mobile, Siemens, and Puma.
However, it’s important to note that the usage of Dynatrace can vary across different departments or teams within these organizations.
Is Dynatrace Cloud-Based?
Yes, Dynatrace offers cloud-based deployment options, including a SaaS model, allowing organizations to leverage Dynatrace’s monitoring capabilities without the need to manage on-premises infrastructure.
Dynatrace’s cloud-based approach provides scalability, flexibility, and automatic updates, enabling organizations to focus on monitoring their applications while Dynatrace handles the underlying infrastructure.
Is Dynatrace Free?
Dynatrace offers a free trial period but is not entirely free for long-term usage. After the trial period, organizations must purchase a paid subscription to continue using Dynatrace’s monitoring and observability services.
The cost of Dynatrace will depend on factors such as the scope of monitoring, the number of monitored entities, and the level of support and additional features required.
Conclusion
In conclusion, navigating the vast terrain of digital performance monitoring tools can be a daunting task. When choosing between Dynatrace and its alternatives, the decision must align with your organization’s unique needs, resources, and objectives.
There’s no universal one-size-fits-all solution, but many viable options offer strengths and potential drawbacks.
Remember that the “best” tool is subjective – it’s the one that integrates seamlessly with your operational infrastructure, optimizes performance, and supports your business’s journey toward its goals.
As you weigh the options, we hope this exploration of Dynatrace alternatives has illuminated the path to your ideal digital performance monitoring solution.