


Splunk became one of the leading log management solutions since it was first released in 2007. It focuses on event management, security incident, and enterprise-grade log analysis, which has made it the de facto choice for organizations that generate large volumes of machine data and log files.
But the log management landscape has changed drastically over the past decade. Modern distributed architectures like hybrid clouds, containers, and microservices are the new norm. Organizations now have more unique options that are better optimized for managing log data and are faster and more affordable.
Splunk is therefore not the right solution for everyone, even if it is one that is used the most. Companies that need a solution to monitor large volumes of data have different Splunk alternatives today. We will be looking at these alternatives here, including tools that work on Linux, macOS, and Windows.
Best Splunk Alternatives – Our Top Pick👌👌
1. Sematext Logs
Sematext Logs is one of the Splunk alternatives that is a log management tool. You can use it to collect logs from the infrastructure and create custom dashboards to monitor the performance trends in real-time. The logs can be searched with a basic query syntax, and you can use it to identify specific events.
Sematext Logs has real-time alerts, reports, graphs and charts, custom dashboards, and log data collection. You can go to the Reports pane to start creating reports when creating a dashboard so that you can collect the specific metrics to monitor.
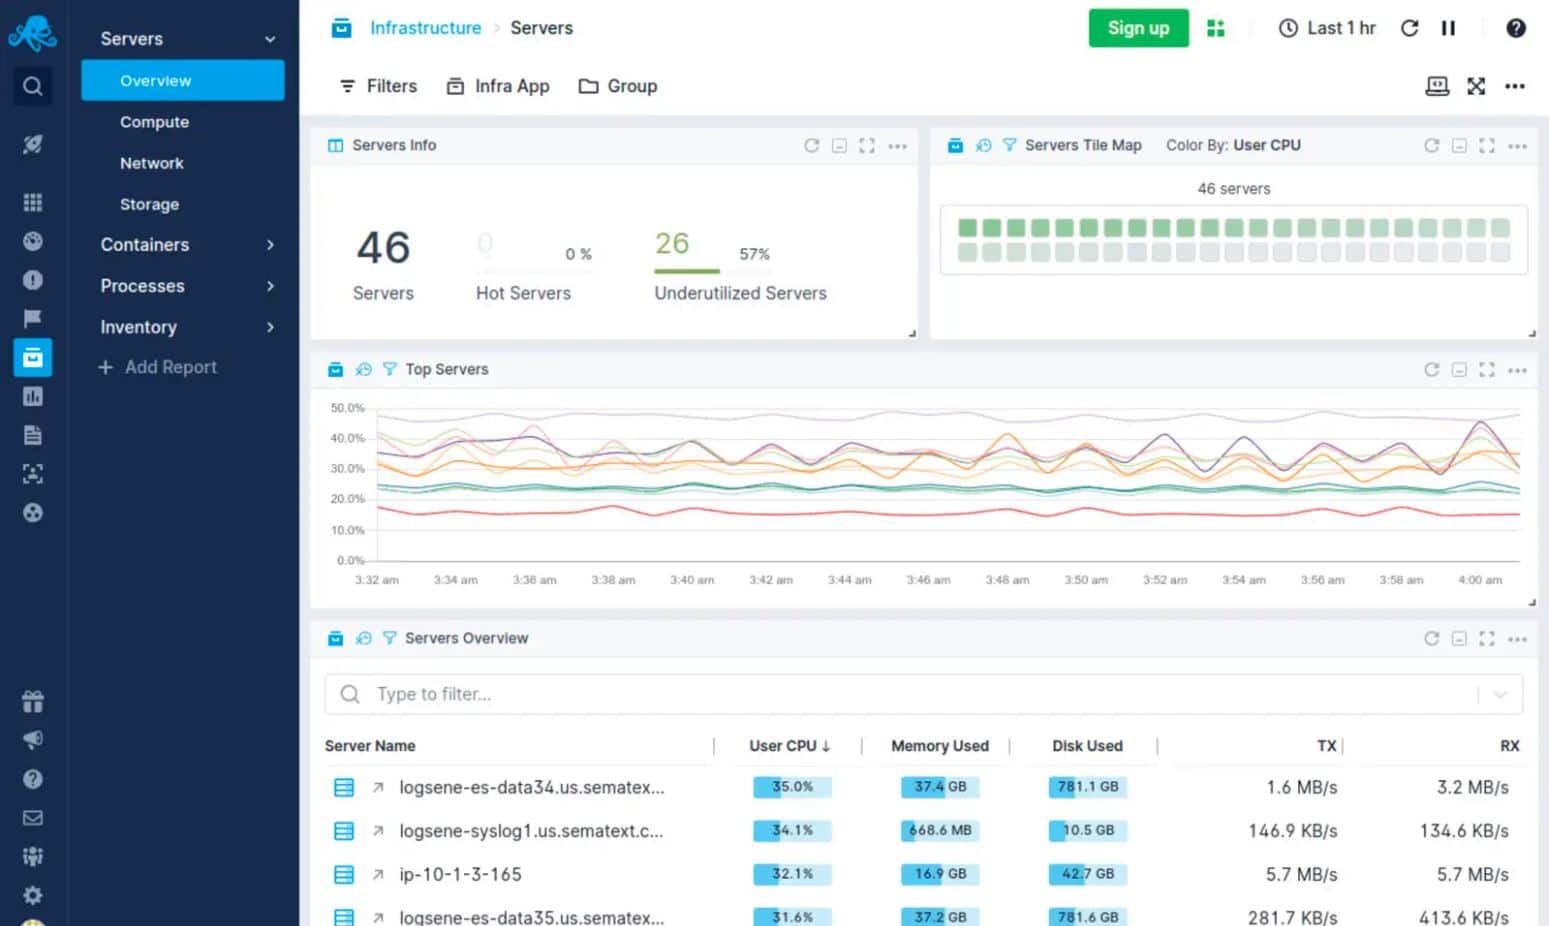
Dashboards also have graphs and charts so that you can visualize security issues and performance. The real-time alerts will notify you automatically by PagerDuty, Slack, or email when specific threshold conditions are met.
It has a freeware version for testing and also supports threshold-based ideals making it ideal for SLAs. It also helps data outside event logs like SNMP reports and uses elastic search to have flexible query options.
For data visualization, it relies on Kibana. One of the top management solutions for affordability on the market also gives you complete control over the monitoring experience. It has a 30-day free trial, and pricing for the Logs package starts at $50 (£39.03) per month.
2. SolarWinds Security Event Manager
SolarWinds Security Event Manager (Get Here) is one of the Splunk alternatives and has a 30-day free trial. It is a SIEM tool that has a log collection that is centralized.
What the platform does is that it collects logs, and then threat intelligence is used to detect threats and will respond to them automatically. The threat intelligence will alert you whenever a security event does happen. Route notifications are received in the mail as well so you can follow up if necessary.
It has a log collection that is centralized, as mentioned, and compliance reports, dashboards, notifications, and automated threat detection and response. The dashboard view here gives a better and wider perspective of the events in the environment.
There are a few different visualization options like pie charts and graphs to identify the performance trends at just a glance. One example of this is how you can see Login Failures by the pie charts from the Source Machine. And through this, you can identify any compromised machines.

You can audit the environment easily using Compliance Reports. Some out-of-the-box compliance reports are also there for regulations like GPG13, GLBA, FISMA, SOX, PCI DSS, HIPAA, and others. These reports can also be generated using templates that are built-in or can be generated.
There are many different types of integrations when it comes to enterprise-focused SIEM. You do not need to know a custom query language as the log filtering is simple.
There are many different templates to help the administrators to begin with SEM with barely any customization of setup. The tools for historical analysis help in finding the outliers that are on the network and anomalous behavior.
However, since this platform is a Siem product that is advanced, it is time to learn the platform thoroughly as it is built for professionals.
This is also a solution that is ideal for those enterprises that need a threat intelligence-driven solution and low maintenance. The prices begin at £1,971 ($2,525), available on Linux, macOS, and Windows.
3. Sumo Logic
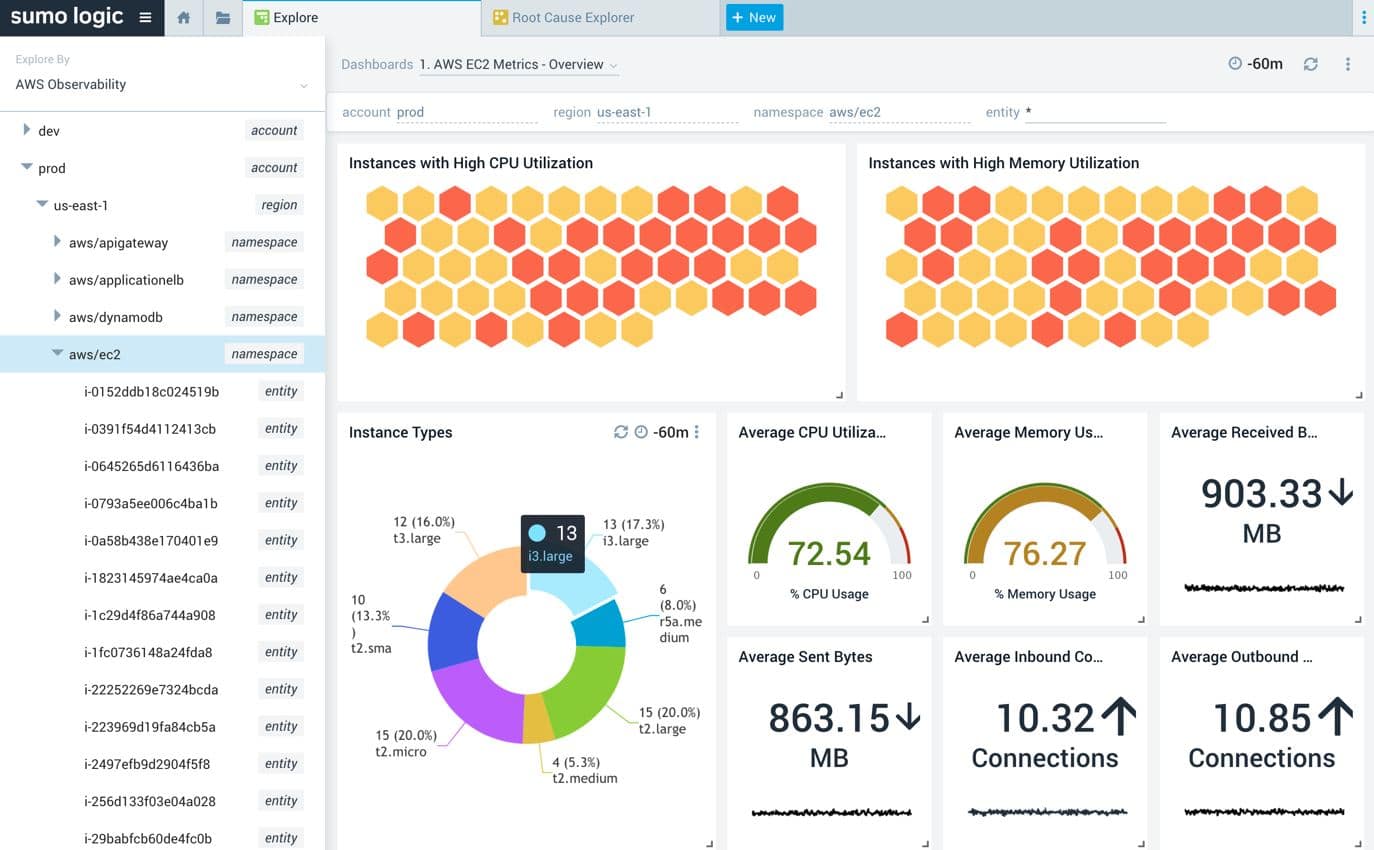
Sumo Logic is one of the Splunk alternatives and is a log management tool that is SaaS-based. This tool can be used to monitor all the services located on the cloud and on-premises.
It also has many different integrations for services like Docker, Kubernetes, Google Cloud, Microsoft Azure, and AWS, so it can fit in well with all of your existing services and tools.
It has integrations, alerts in real-time, threat intelligence, charts and graphs, dashboards, and log collection. The Dashboards are equipped with predictive analytics, charts, and graphs so that you can get a very comprehensive view of all of the security events.
This makes it faster to identify and solve issues as and when they happen. There is also machine learning-driven root cause analysis that can be used to determine the origin of a problem as you remember it.
Threat intelligence highlights in real-time the Indicators of Compromise (IOC) so that you can faster identify any threats to the infrastructure. The anomaly detection will enable you to identify any performance anomalies, while alerts will notify you about these threats in real-time. This way, you can quickly take action and resolve them.
It uses intelligent alerting to reduce any duplicate notifications. AI to suspicious group events for analysis is done automatically, and it also has a highly customizable dashboard with visualizations. But the learning curve can be a bit steep in comparison to other products, and the initial onboarding and integrations can be complicated.
This is one of the trusted and reliable SaaS-based platforms and even deployment is easy. The pricing here begins at $3.00 (£2.34) for the Essentials version, per GB of logs. It includes real-time alerting, dashboards, and log analytics. Here the freeware trial is for 30 days.

4. LogRhythm
LogRhythm NextGen SIEM Plattform is one of the Splunk alternatives and is a log analysis tool that has the LogRhythm XDR stack. The stack has three different tools: LogRhythm RespondX, LogRhythm DetectX, and LogRhythm AnalytiX.
It has an integrated SOAR, alarms, AI engine, structured and unstructured search, custom dashboards, and centralized log storage. AnalytiX stores log data centrally, and you can navigate through it with searches that are structured as well as unstructured.
You can view the log data through the custom dashboards as well as it includes visualization options for more profound and better visibility. Potential threats are identified as the AI engine analyses logs for them. The engine has more than 900 customizable correlation sets.

DetectX offers security analytics that identifies any security issues and will then trigger the alarms. The tool recognizes threats automatically with machine learning to identify any problematic patterns, which are then highlighted to the users.
The integrated SOAR solution RespondX helps you perform remediation tasks after a threat has been detected by the system.
LogRhythm leverages AI and machine learning for behavior analysis. The interface is visually appealing, highly customizable, and sleek. Simple wizards are used to set up the security tasks and the log collection. This makes it a tremendous beginner-friendly tool. But there is no trial option and no cross-platform support.
5. Loggly
Loggly is one of the Splunk alternatives that has a free 14-day trial. This is a free SaaS-based log monitoring tool that can process large volumes of log data from any source.
You can use this platform to see log events in real-time from various sources like operating systems, mobile apps, databases, cloud platforms, and a lot more.
You can see an overview of performance for systems through the dashboard. And this is throughout the environment, along with metrics that go to the request level.
Loggly has reports, alerts, graphs and charts, dashboards and can collect and aggregate logs. The dashboard is customizable so that you get offers and charts to visualize the performance.
The feature for time shift lets you change the time period that a specific chart shows. This can help you catch performance concerns a lot more easily. You can also use a prebuilt template if you do not want to make your dashboard.

You can also create alerts that will alert you to any security events in the environment. The alerts are sent on this platform by Microsoft Teams, PagerDuty, Slack, and other Webhook-compatible services so that you get the latest information at all times. You can convert the dashboard into a report to create one and then export it in PNG format.
Loggly lives on the cloud so that Syslog servers can scale regardless of the onsite infrastructure. There is no lengthy onboarding process, and setup is straightforward.
It can easily pull logs from cloud platforms like Docker, AWS, etc. The data is available immediately for analysis and review. There is a completely free version that is available with limited retention.
The free trial, however, as mentioned, is only 14-days long. It is an excellent solution for those enterprises that need a tool that requires no agent and can handle data from practically any log source.
Only one user is supported in the free version, so you need to pay if you want more users. The prices start at $48 (£37.48) per month for the Standard version, where three users are supported.
6. Paessler PRTG Network Monitor
Paessler PRTG Network Monitor is one of the Splunk alternatives that is a network monitoring tool that is free and also has log monitoring.
You can collect log data on this platform using out-of-the-box sensors. The sensors use numerical values and dials to display performance data so the historical performance data and live data can be monitored efficiently.
It has automated responses, alerts, a Syslog Receiver Sensor, a Windows Event log sensor, an out-of-the-box sensor, and log monitoring. The Windows Event Log Sensor is handy for log management, and users can use it to monitor Windows log files, including application and system logs.
Another valuable sensor worth mentioning is the Syslog Receiver Sensor that lets you monitor how many Syslog messages are received per second, the number of error messages in a second, the number of warning messages in a second, and more.
Paessler PRTG Network Monitor can be configured using threshold-based alerts to send notifications as and when a critical parameter gets exceeded. The system can also send these notifications as SNMP traps, Slack messages, push notifications, SMS messages, email, or even respond automatically by executing HTTP programs or actions.
The platform can be used to set up internal monitoring of user activity, applications, and networks. Can alert via a few different mediums to ensure that all the right teams remain in the loop.
Pricing is based on usage, so this is a scalable platform for both small and large networks. The platform is flexible so that businesses can expand their monitoring capabilities with ease.
PRTG is a platform that is feature dense, and time needs to be invested using all of the available features. This is the right choice for small and medium-sized enterprises that need a log management system that is low cost.
The Freeware version supports up to 100 sensors. The paid versions begin for 500 sensors at £1,367 ($1,750). PRTG works on Mac and Windows.
7. Elastic Stack
The Elastic Stack, once called the ELK stack, is a log management system that is open source and has four projects:
- Kibana: an Elasticsearch tool for data visualization
- Elasticsearch: an analytics and search engine
- Beats: agents that are used for the collection of data that is then sent to Logstash
- Logstash: log ingestion and processing pipeline
All tools that are needed to view, ship as well as ingest log data using a web-based UI are provided in the base installation. Users can download and use this platform for free as it is open-source.
This means that it benefits from hundreds of plugins, a developer community that is active, and assistance for various input sources and formats. But running this is direct as other solutions that are similar.
Extensive setup and configuration are needed for Elasticsearch before being used as an enterprise-scale log management solution. And this is a self-hosted solution primarily.
But the company that manages this platform—Elastic—offers cloud-hosted Elasticsearch as a service. Only via third-party providers like Azure and AWS are hosted Kibana and hosted Logstash available.

The freeware version of Elastic Stack is limited when it comes to functionality. Features that you would find in the various log management solutions like graphing, reporting, alerting and access control can only be had via a subscription.
Elastic Stack is expensive for hosting, and running at an enterprise scale for about just three years can cost about $2,000,000.
8. LogDNA
LogDNA is a log management software that is free and can be used to collect as well as monitor log data. Exclusion rules with LogDNA can be used to reduce the volume of log data that needs to be monitored.
This makes it a lot simpler to identify significant security events. Charts and graphs are the visualization options available that can be used to monitor log data at a glance.
It has team controls, usage reporting, alerts, graphs and charts, exclusion rules, and also collects and monitors log data. You get immediate notifications about any system events with the alerts.
The platform is also integrated with services like Webhook, Slack, PagerDuty, as well as other APIs. This way, you can get alerts where your team is most active. The usage reporting gives you updates on log usage and in this way you can easily manage the consumption of resources.
Team control gives you many different features that work well for a team. Role-based access, for example, lets you limit access to sensitive data. Here the SSO/SAML user authentication will ensure that protected data is being accessed by authorized users only.
It has a vast API library that can be used for integration into other messaging platforms and tools. The powerful exclusion rules are simple and easy to create and customize.
The interface is minimalistic so that key insights can be highlighted. The reporting, however, could perhaps be a little easier, especially when it comes to creating custom reports.
The freeware trial is only for two weeks for LogDNA. It is a great solution if you want to cut down on manual log processing. The free version offers unlimited hosts and services for a single user. Paid versions begin for up to five users at £1.17 ($1.50) GB every month, and this is for up to five users. It is available on Linux, macOS, and Windows.
9. Datadog
Datadog also offers a 14-day free trial and is one of the Splunk alternatives that lets you centrally collect log data from any of the sources. You can collect, search, and filter all your logs using Datadog to identify the security events. You can view log data through the dashboard using charts and graphs.
It has alerts, log-processing pipelines, filters, graphs and charts, dashboards, and central log collection. The platform gives you the option to make log-processing pipelines.
These pipelines allow you to process logs automatically that are collected from integration. One example of this would be creating a pipeline for MongoDB or NGINX so that data can be extracted automatically from those services.

The alerts here tell you when there is a performance issue that an essential service is experiencing. Alerts can be routed to external services like Hangouts Chat, Microsoft Teams, and Slack so that the team can process all of them more efficiently.
Datadog has an interface that is highly customizable and easy to use. The cloud-based SaaS product here allows for monitoring with no onboarding costs or server deployments.
There is also support for auto-discovery so that network topology maps can be built on the fly. The changes made to the network get reflected in practically real-time. Businesses are also allowed to scale their monitoring efforts through flexible pricing options.
Here too, the trial period is only two weeks long. Datadog is a solution that works for enterprises that need a cloud-based log management solution that has rich data visualization options and a versatile log collection.
The Log Management package beings at $1.27 (£0.99) per million log events and a month with a retention period of seven days.
10. Fluentd
Fluentd is a platform that is used to ingest semi-structured, unstructured as well as structured data. It is an intermediary between outputs and data sources and converts and routes the data for different programming languages, applications, services, and platforms.
It is used as a data aggregation service for Microsoft Operations Management Suite services like a tool that is open-source.
It is a service for data collection and routing, but it does not include management services and log shipping. But it integrates with various solutions using plugins that add support for various outputs and inputs.
One example is that using the CloudFront-log plugin is where support for ingesting logs via Amazon CloudFront can come from. But logs get routed to Elasticsearch through the elastic search plugin.
But this means that you need to make your own log management solution from scratch, and ingestion and routing services will be provided by Fluentd.
Fluentd is a free platform, but just like Elastic Stack, it can become expensive as time passes by. It relies on components to create a log management solution, but it does have a small memory and CPU footprint. A lengthy customization and setup process with all of this makes it harder to set up and maintain when compared to other platforms.
11. ManageEngine EventLog Analyzer
ManageEngine EventLog Analyzer (Get Here) is a SIEM tool and one of the many different Splunk alternatives.
You can use this platform to monitor the system logs and collect them from more than 700 sources with a mixture of log imports, agent-based log collection, and agentless log collection. You can navigate through the collected logs to identify the most significant of the security events with customizable filters.
ManageEngine EventLog Analyzer has compliance reports, real-time event correlation, alerts, filters, and log collection and analysis. You can identify attack patterns using real-time event correlation analyses log data.
The software has about 30 preconfigured SIEM correlation rules so that you can determine when an alert has been raised. These correlation rules can be customized and stoefine the other attack patterns and set trigger conditions, and the platform will respond to them.

There are compliance reporting templates that let you prepare for auditing for frameworks such as IS 27001, SOX, GDPR, FISMA, HIPAA, DSS, and PCI. You can also schedule reports to automatically run and then export these reports in CSV, PDF, AND HTML so that you can share them with the rest of your team.
File integrity monitoring is supported, and this can act as an early warning system for permission access issues, data theft, and ransomware. You can also use anomaly detection to help technicians in their daily operations.
Multiple alert channels ensure that teams get notified across app integration, email, or SMS. The dashboards are customizable and work well for network operation centers.
However, there is no mobile app, and it can take some time to explore all of the offered products. This is an excellent tool for those enterprises that need a primary event log management tool.
They have a free version, which supports five log services, and the Premium Edition starts at $595 (£464.64). It is available on Linux and Windows.
Conclusion
If you like Splunk but feel that it could have better features, then this article should help you find the best Splunk alternatives to get one that will work the best for you.
Datadog and SolarWinds Security Event Manager are the best as compared to the other alternatives mentioned here. This is because of the excellent visualization options that they have as well as the state-of-the-art GUISs.
But we recommend that you research various tools before getting one that suits you best. Many of them have free trials so that you can get a better understanding of what each platform has to offer.
However, the best solution will be based on the insights you want from log analysis and the specific requirements that you would have, so in this way, you have a solution with all of the features you want.