


Technological developments have shifted businesses from a traditional outlook to a more modern approach to day-to-day activities.
All the departments within an organization have gone through massive changes in the past two or more decades. From communicating within the organization to delivering data, many aspects have efficiently experienced development.
In this article, we focus on different Gantt Chart Alternatives. The data is complex and cannot be deciphered by an ordinary man.
In today’s time, there are several data presentation tools available in the market. These tools make it easier for the readers to comprehend the data.
The tools present data in visually pleasing forms. These tools can also be used to make strategic plans and automate the scheduling of reports for tracking progress. One such tool is a “Gantt Chart.”
What is a Gantt Chart?🤔
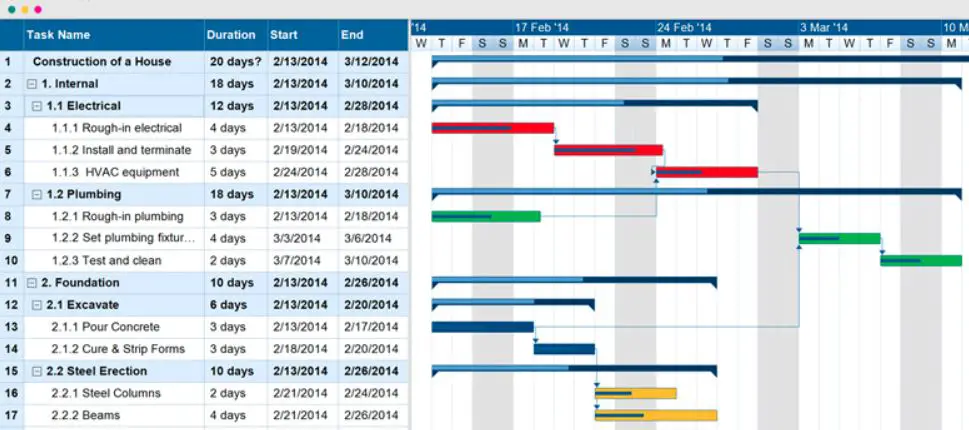
A Gantt Chart is one of the most prominent project management tools available in the market. It assists in the formulation of strategic plans and the listing of assignments of varied sizes. The chart helps in simplifying complex data into an understandable format.
These assignments are portrayed as horizontal bars that have their start and end dates marked on them. The name of the person the project is assigned to is also mentioned along the bar.
The chart helps in tracking progress at every stage of project completion. This feature is helpful in organizations with large teams and various stakeholders.
The motive behind creating the Gantt Chart is to lay down the details of tasks that can be performed simultaneously and the ones that must be given priority and undivided attention.
The combination of the Gantt Chart and other project resources helps analyze the amount of work to be done, the cost which will incur, and the time required to complete the job.
The creation of this chart is an uncomplicated process. The designer has to list all the tasks that must be performed to complete a project. This process helps in giving an estimation as to how long the project will take to be completed.
The designer will also gain an understanding of tasks that are dependent on one another. Such a detail-oriented process helps the project manager realize which projects are more crucial than others.
Making a Gantt Chart is straightforward but has a few drawbacks. In the case of many tasks, the chart can become shabby and hard to understand. The allocations of names and dependencies can make the chart more complex.
There are chances of losing sight of the project’s purpose in publishing a complicated chart. Gantt charts are unsuitable for displaying priority-based tasks if there is a long list of projects.
In this article, we will take a look at Gantt Chart alternatives.
Best Gantt Chart Alternatives – Our Top Pick👌
1. Project Management Timeline
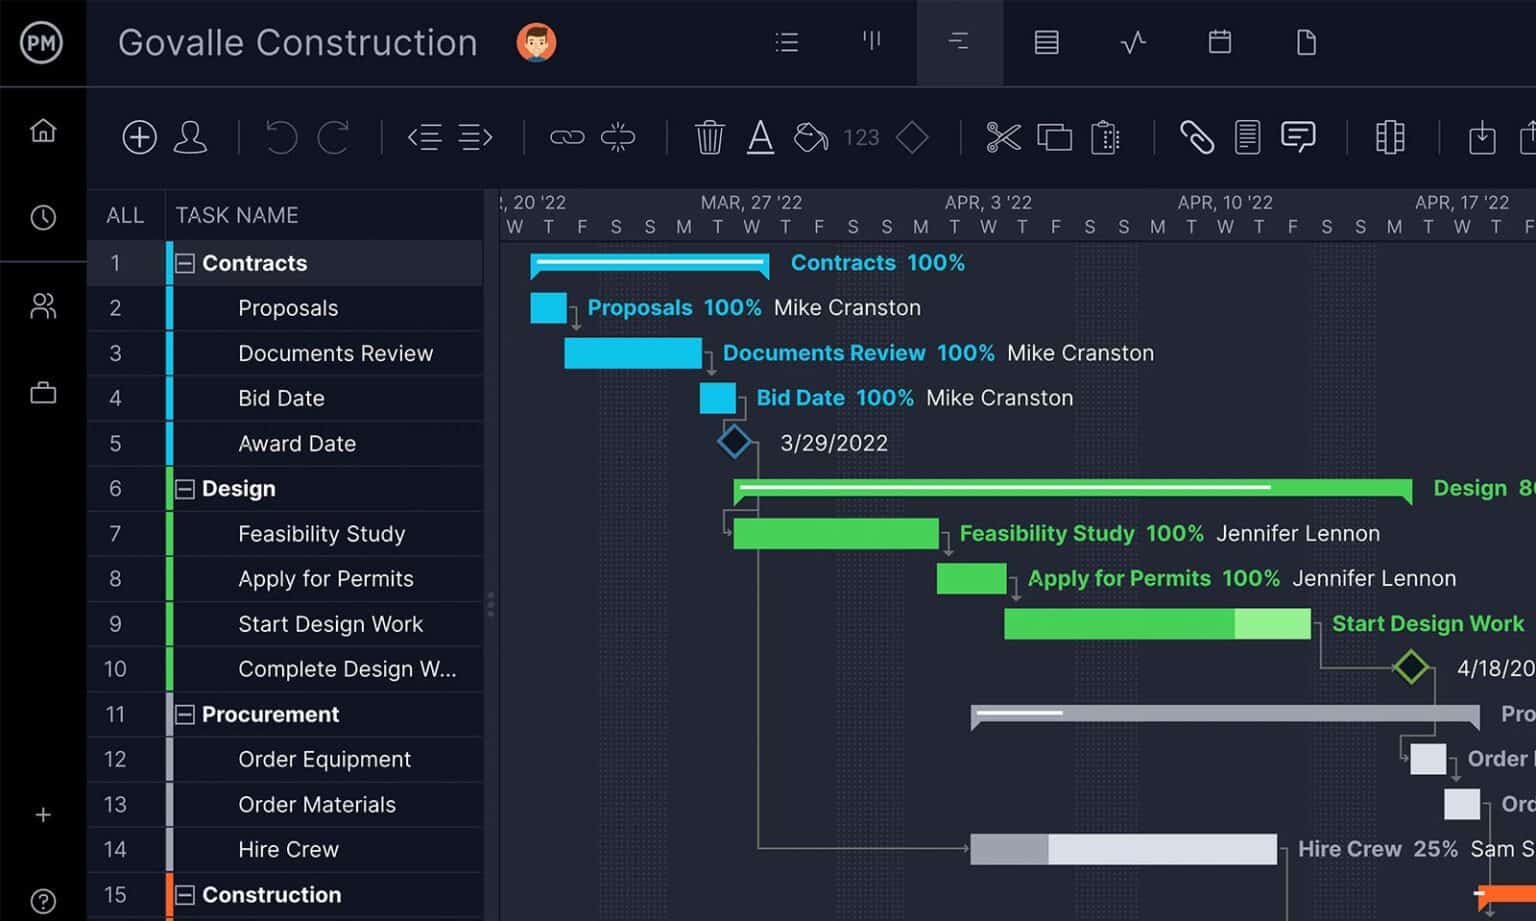
The Project Management Timeline tool (Visit Here) is the first on our list of the best Gantt Chart Alternatives that function the same way as its name suggests.
It builds a project timeline, denoting its starting date and ending date. It is a simple way of jotting down the steps required to complete a task in sequential order. It does not require any other details. There is no chance of information overload.
The tool is easy to comprehend, flexible and allows modifications to be made when the need arises.
The project management timeline is easier to explain to the public as it does not deal with the complexities of many information types.

A timeline provides an overview of the work that has to be completed and its time. The timeline helps the organization to increase work efficiency by making a clear list of work goals.
A project management timeline helps resource allocation by providing a plan for project completion in advance. The employees can then gather the necessary resources required at every step to maintain higher productivity levels.
Project management timelines break huge-dreaded tasks into small doable activities. This mechanism helps in reducing the pressure upon the employees.
The process of creating a project management timeline is simple. The designer has first to understand the purpose of the project.
The project scope has to be identified. This means that the organization should have a clear idea about the objectives that it wishes to accomplish using this project.
The next step is to break down the project into smaller tasks and define deadlines for these smaller tasks. Online tools can help organizations share a list of smaller tasks with all their employees at once.
Once the deadlines are clear, estimate how much time every small step will take to be completed. Write down the estimated time against the tasks. After evaluating the required time, assign priorities to the tasks.
Identify which jobs require undivided focus and which tasks can be done simultaneously to save time. Estimating time will help in modifying deadlines.
2. Project Schedule Network Diagram
The Project Schedule Network Diagram is a method that helps find out a project’s critical path. A critical path is the amount of time a project takes to finish. A project schedule network diagram consists of “activities on nodes(AON)” nodes.
These nodes portray the steps required to complete the project. The arrows in the diagram denote the steps’ flow, which tasks can be done simultaneously, and which need full attention.
The project Schedule Network Diagram also consists of leads and lags. Lead time is the time that has passed between the task’s start and end.
Lag time is the time gap between two tasks. The network diagram provides a logical sequence of events that emphasize the crucial steps in a project.
This diagram is further used for analysis or the critical path method as input for setting deadlines. A Schedule network diagram can also be used for communicating with the stakeholders.
A schedule network diagram becomes a little complicated in the case of larger projects. Making a network diagram becomes detailed as the number of tasks and dependencies increases.
The sequences are also laid out clearly to avoid any confusion. A schedule network diagram is also used to document the activities’ slacks and floats.
A float interchangeably used as Slack is the amount of time a task can be put on the waitlist without affecting the project’s overall timeline.
Slacks, lead time, and lag time are the foundations of the critical path method that helps find out the longest path to completing a project. The process of drawing a schedule network diagram is straightforward. Begin with defining a starting point.
Then make an arrow pointing towards the future and enter activities known as the future nodes. These nodes can carry other small details associated with the task.
Once all the activities are listed, connect them with arrows. These arrows will define the flow of the project. Estimate every activity’s lead and lag times and write them beside it.
Define relationships within the activities. After the dependencies are made clear, finish the diagram by drawing an endpoint.
3. Kanban Board
Gantt Charts are more suitable for projects that have to be completed step-by-step. However, not all projects need to be done in the same manner. Projects can require several steps to be assembled to get the correct result.
Kanban board helps in making timelines for non-linear projects. Kanban has its origins in lean manufacturing.
Lean manufacturing is a method of production that aims to reduce wastage while increasing productivity.
Under the lean manufacturing system, companies do not hold any inventory. The inventory is bought only when its need arises.
This mechanism helps reduce inventory holding costs. Kanban boards follow these exact principles of productivity and efficiency.
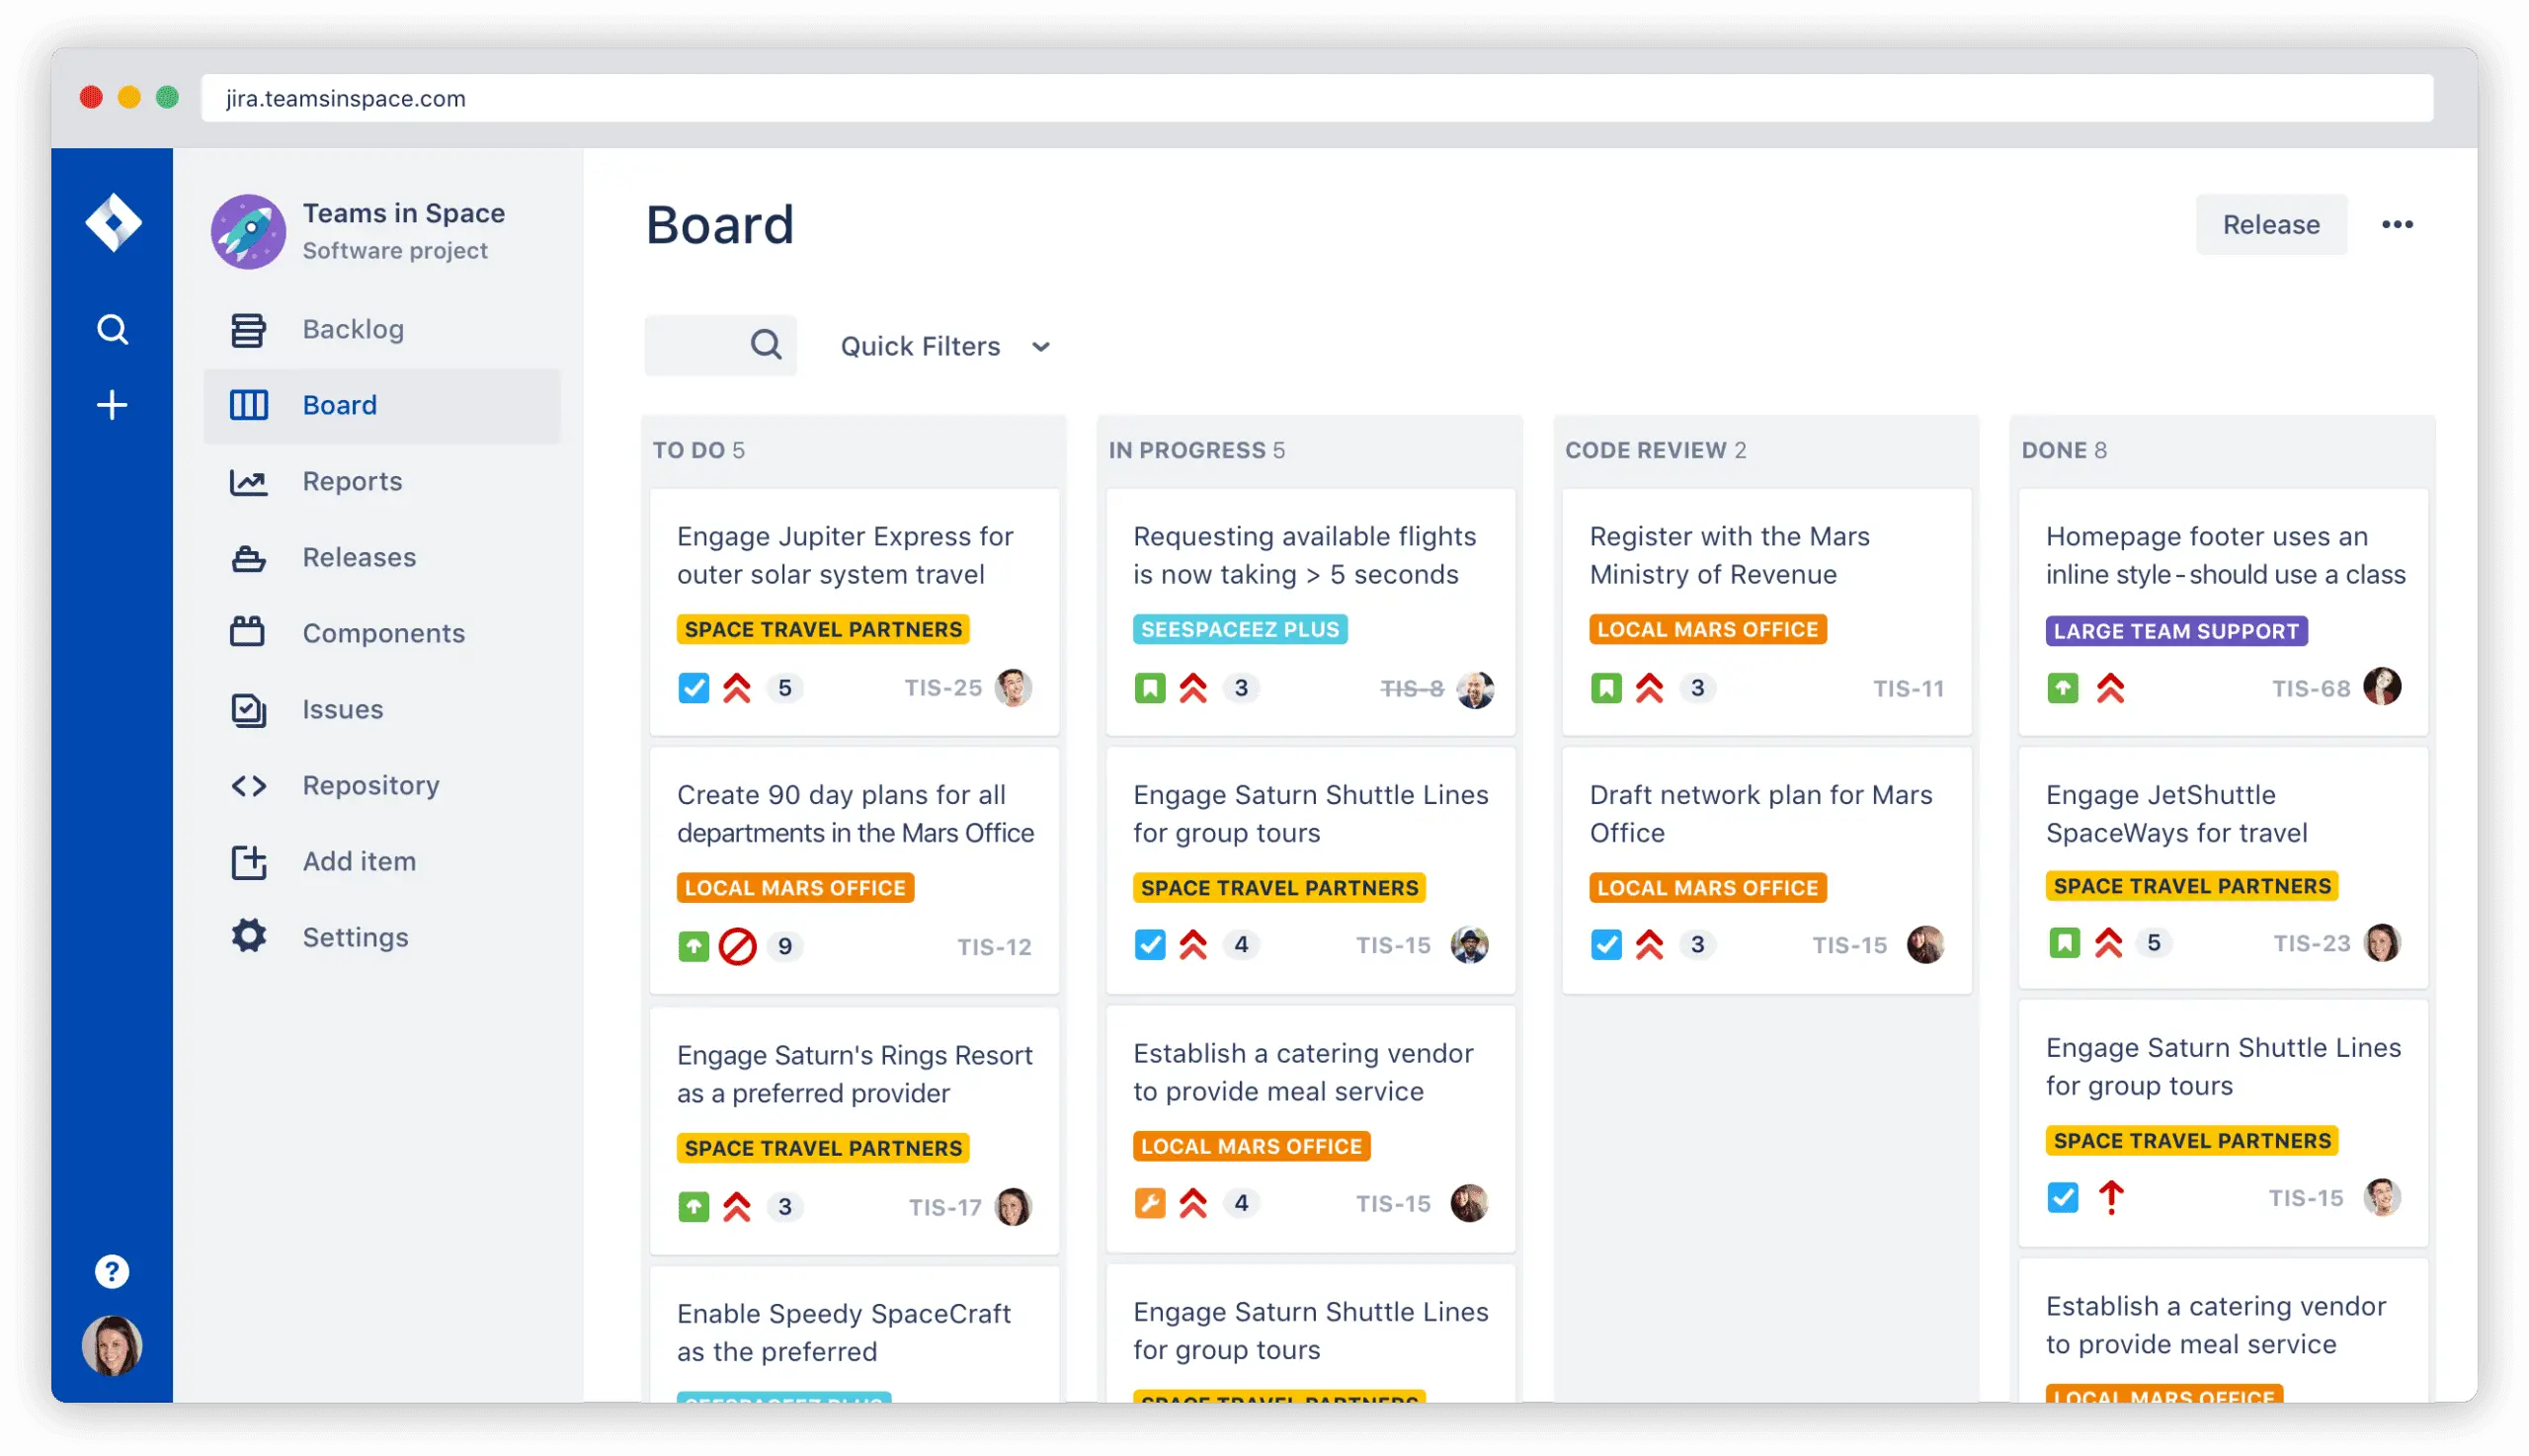
The panels represent the work items, which helps the team members check every piece of work.
A Kanban board helps visualize workflow, reduce when merged with project management techniques and work-in-progress activities, and enhance productivity. The board is suitable for projects in the field of software development.
A Kanban Board has four elements required for a successful project management plan. The first element is columns. Every column defines a particular activity. These activities reduce obstacles and help visualize when combined for the complete workflow.
Every activity is written on a visual card and is placed in the respective column. These cards follow a sequence until the task at hand is completed.
The workflows can be divided into three categories, “To-Do lists” or “In Progress tasks” or “Completed tasks.”
The second element of a Kanban board is Work In Progress (WIP) Limits. WIP limits are the specified number of cards that can be present in the column. A column with a Work In Progress limit of five cannot have more than five cards.
If the Work In Progress limit is exhausted, the team members must remove the old cards and make room for the new ones in the workflow.
Work In Progress limits is crucial for reducing stoppages in the workflow. These limits help avoid work overload by setting restrictions on the amount of work that can take place during a period.
The third element is the Commitment point. It is natural to have pending work to be present on the board.
In such situations, the team members and customers can put their ideas forward to keep the workflow smooth while finishing all the tasks. The point at which an idea is found to be valid and put into use is known as the commitment point.
The last element is the Delivery Point. The end of a Kanban board’s workflow has become known as the delivery point. The delivery point is when the product or service is made available to the final user.

The teams should focus on taking cards from the commitment point to the delivery point as quickly as possible. Reducing lead time will help customers to receive their products sooner. A reduced lead time is directly proportional to consumer satisfaction.
For making a Kanban board, only two rules should be followed. Reduce work in progress and visualize your work. A reduction in work-in-progress tasks will help in enhancing productivity and will also lead to less procrastination.
Visualization helps in gaining an overview of the timeline of a project. This lets the team members know how their time and resources should be allocated.
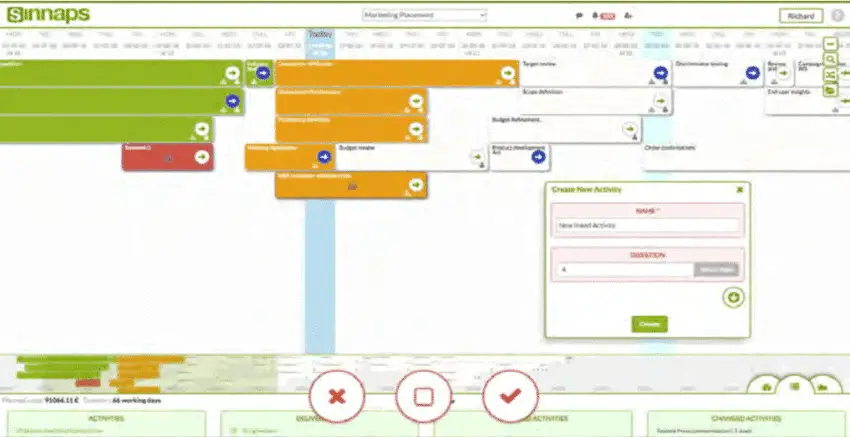
4. Scrum Board
Scrum Board is a project management method similar to a Kanban board. Its foundation is based on iterative and incremental methodologies.
The functionality of the scrum board is flexible and dynamic and aims at delivering value to the customer quickly. Scrum board is made using a value known as sprint. A sprint is the basic unit of work.
Sprint review helps in evaluating the progress of each task every 24 hours.
The Scrum board is conveniently scalable and requires less market time. It gives a close to accurate prediction about the time needed for the completion of projects.
With the help of such predictions, team members can be made aware of any threats to the project and make timely preparations for such threats.
The scrum board comprises a whiteboard or a blank wall space with columns and sticky notes. The columns are of three types, Todo, Doing, and Done.
These columns help in tracking the work at a glance. The Scrum board allows the makers to visualize the work through the columns. These insights help get an accurate idea about the pending work.

An adequately curated task list increases efficiency by reducing the chances of errors. It gives a chronological order for tasks to be completed.
The functioning of a scrum board can be adjusted according to the organization’s culture. Scrum boards help keep the project spirit alive by allowing the team members to get constant updates.
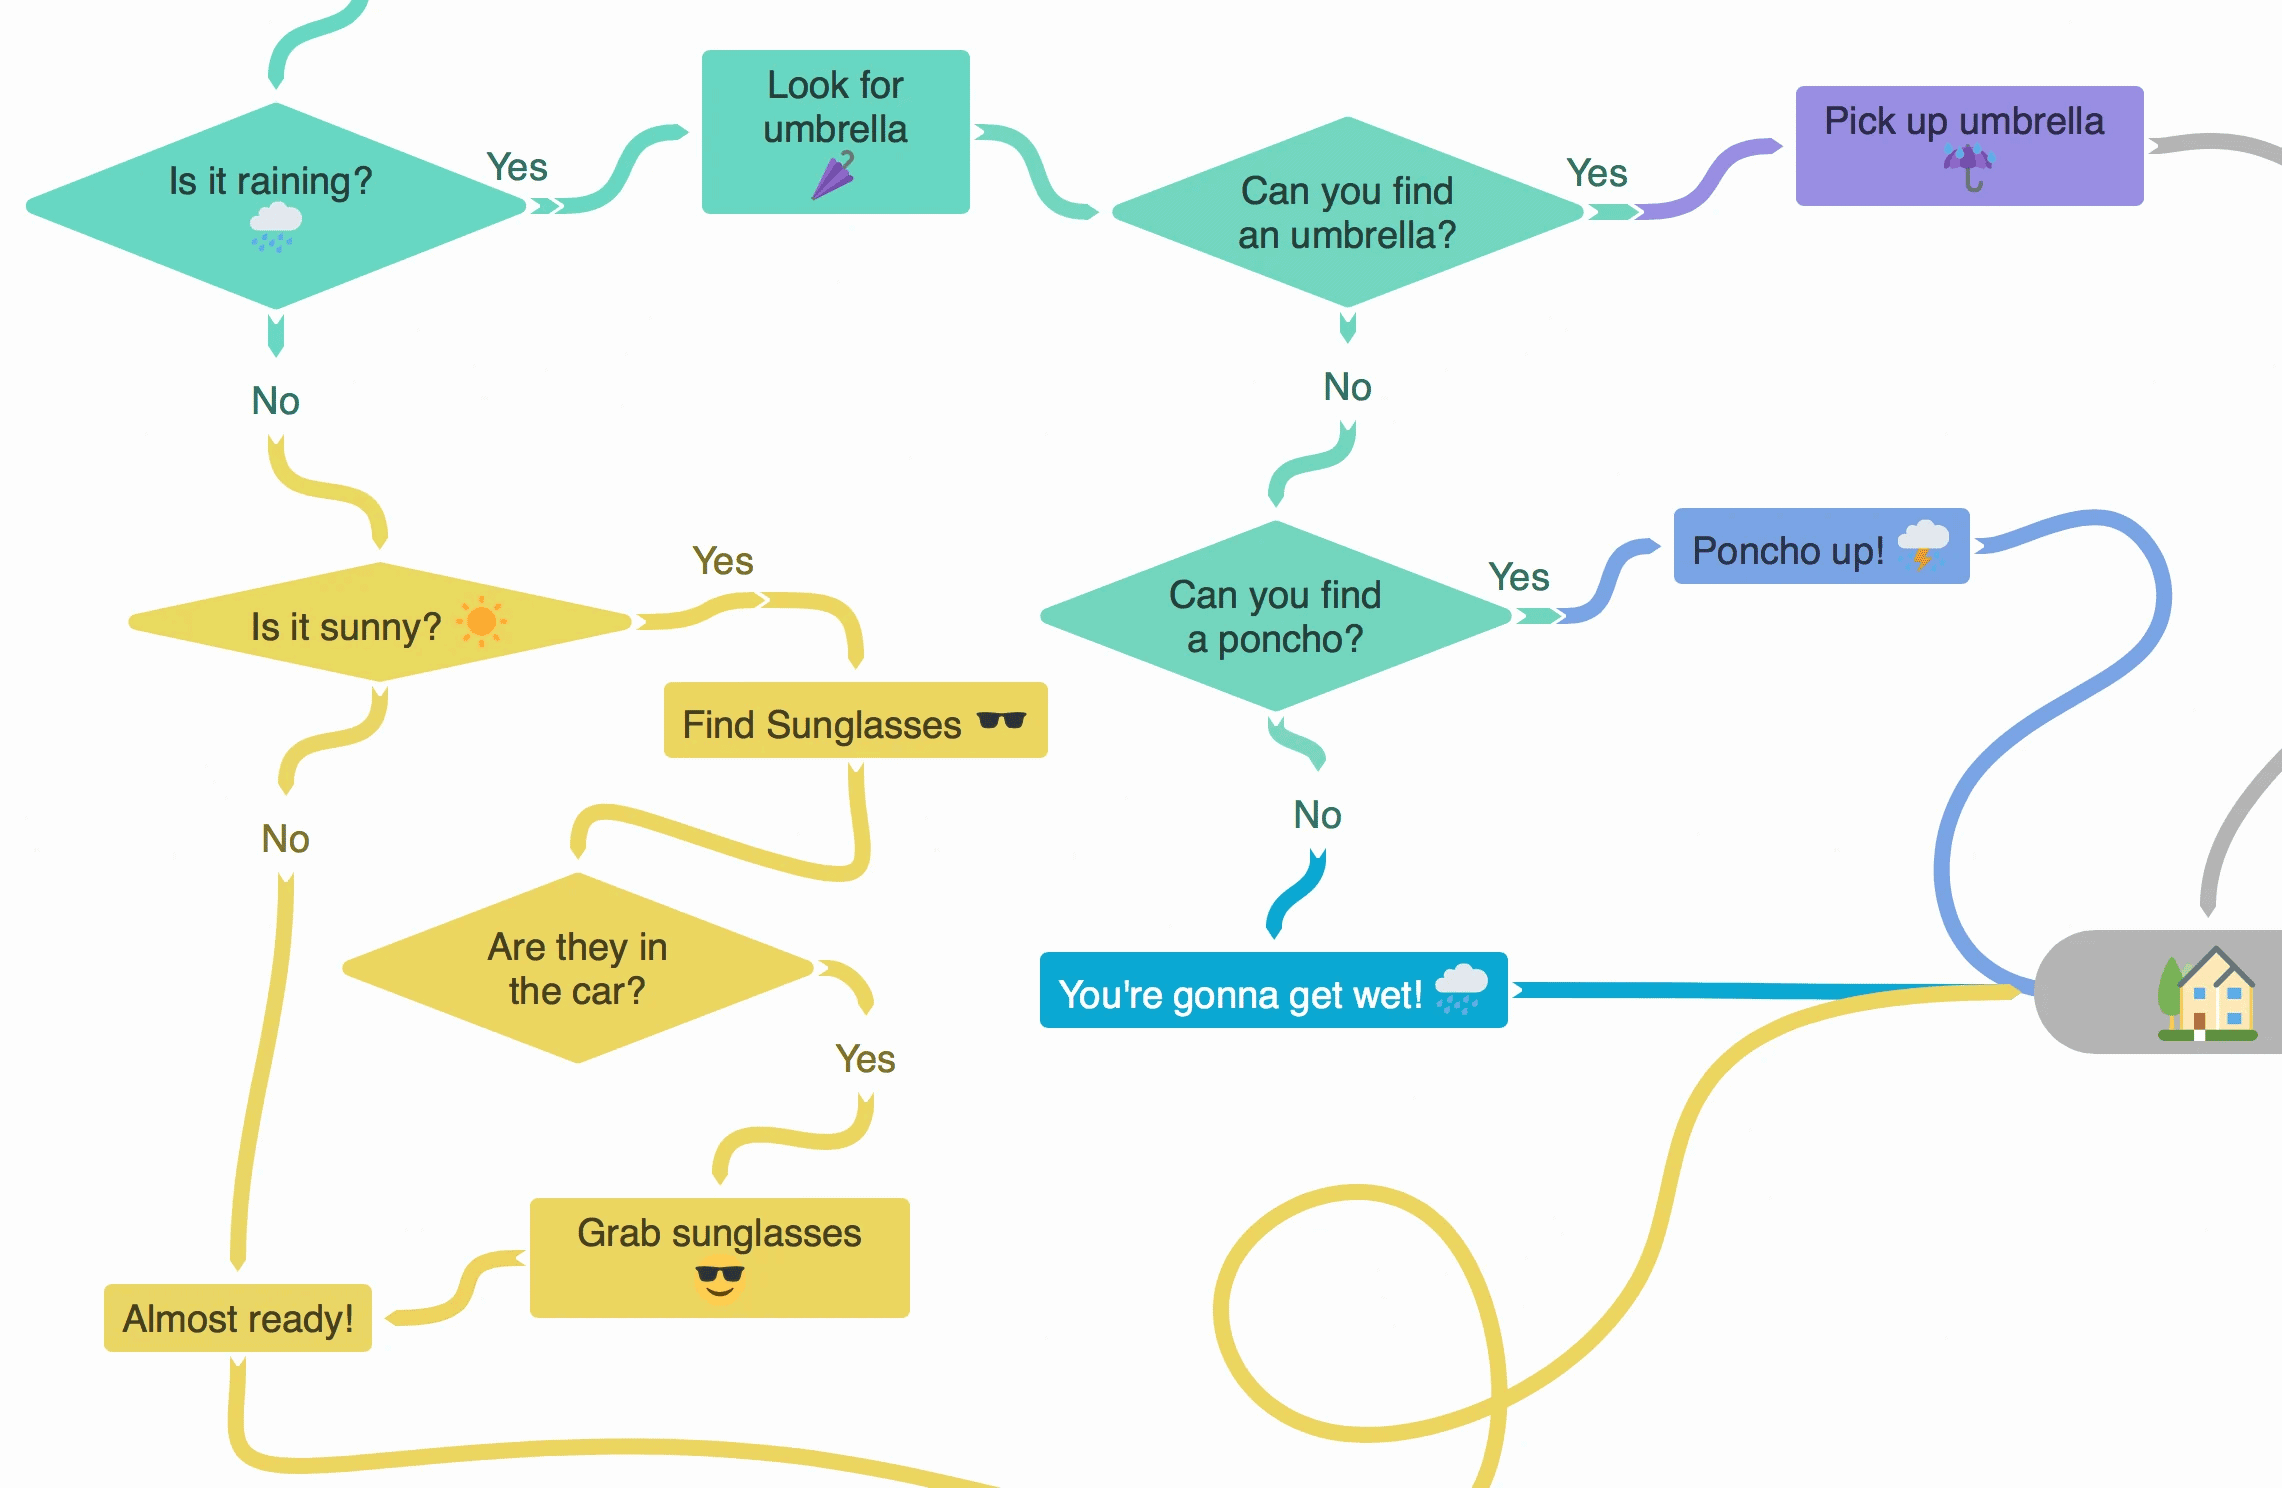
5. Cross-Functional Flowchart
A flowchart is a sequential representation of processes or systems with connecting arrows. It is a simple way to transform complicated methodologies into easy-to-comprehend values.
A simple flowchart makes way for a cross-functional flowchart when merged with project management techniques.
A cross-functional flowchart shows steps of how a project should be completed.
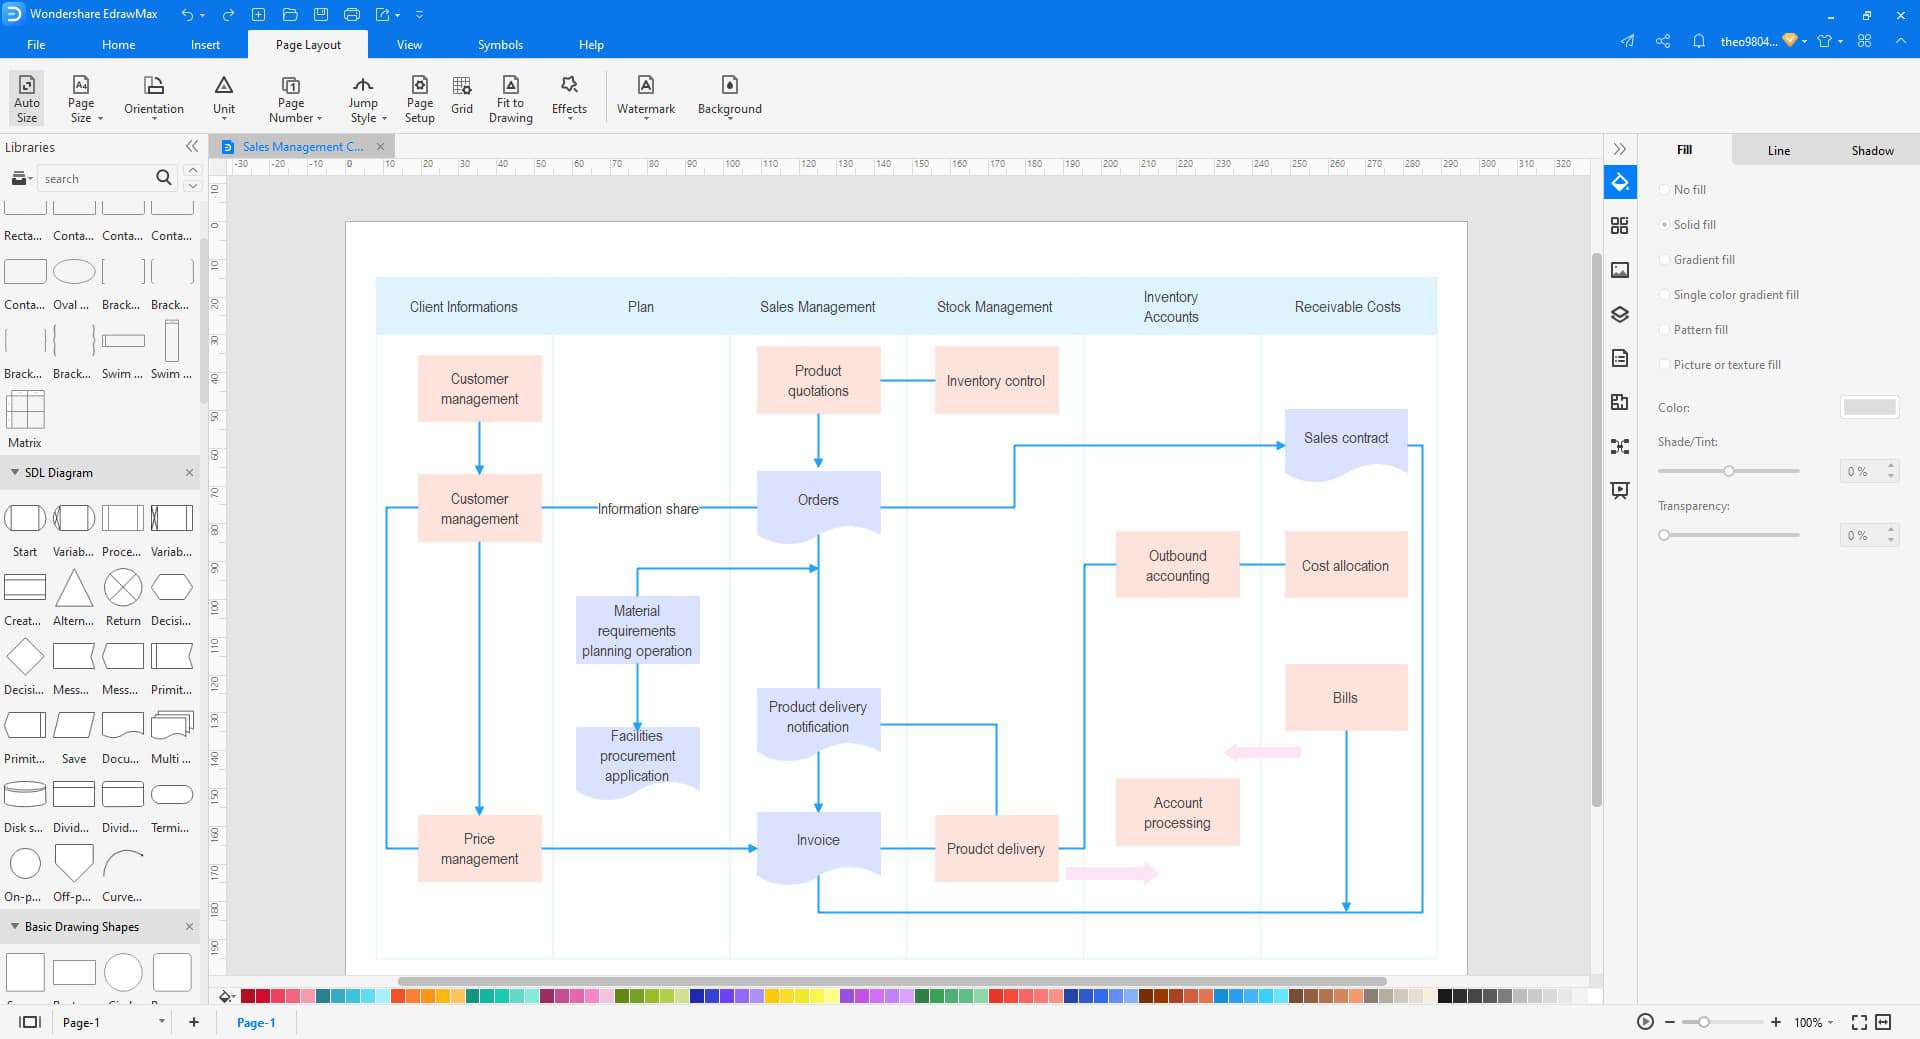
The differentiating factor of this flowchart is that it carries other details related to the project, like the name of the person who is accountable for the task, deadlines, and more.
Cross-functional flowcharts use a mechanism known as swimlanes that helps assign responsibilities among people from different departments. These flowcharts are suitable for large projects as tracking work progress becomes more accessible.
The clear distinction of work responsibilities brings clarity into the workflow. A cross-functional flowchart defines the timeline of the tasks either in a step-by-step form or in a grid-like diagram.
Every step is put in a category in a grid diagram to ensure no step gets skipped. The step-by-step format becomes similar to that of a traditional flowchart.
However, traditional flowcharts are insufficient for dealing with large amounts of data.
Cross-functional flowcharts are the right choice if you are looking for Gantt Chart Alternatives for many people in a group.
This type of flowchart is put into use to define the relationship between steps and the relationship between different people within the organization.
Cross-functional flowcharts help visualize the timelines of the tasks so that the team members can gather the necessary resources at the right time.
6. Project Checklist
An essential tool for project management is a project checklist. It is a simple to-do list that carries all the tasks related to a project. The simplicity of this checklist makes it suitable for short projects.
It helps in increasing productivity in the organization. A project checklist is similar to a standard checklist.
All the tasks are listed, along with the resources required to complete them. There is no chance of forgetting any task.
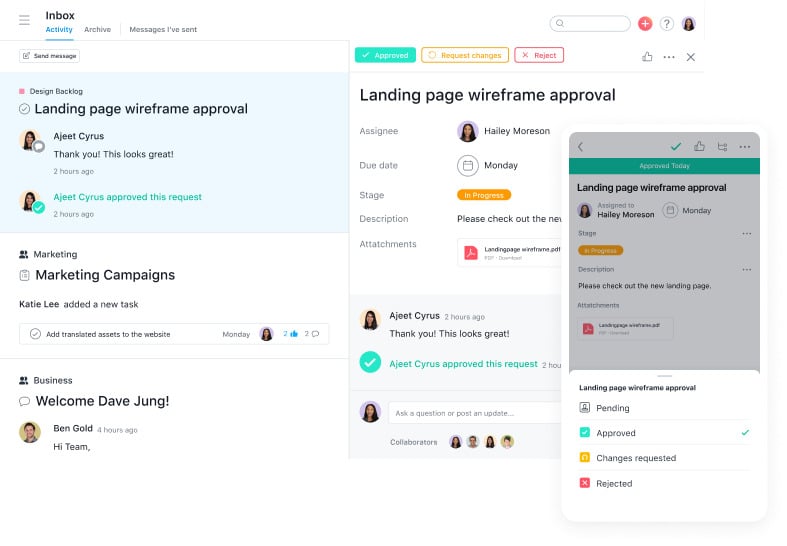
Sinnaps is a project management software that helps in building simple project checklists. A project checklist’s main aim is to ensure no task is left without action.
It acts as a systematic list but also reminds evident work-in-progress activities and works yet to be done. Project checklists allow the team members to eliminate pressure caused by large projects. It shows a real-time overview of the work.
The satisfaction of checking off a task from a to-do list is worth experiencing. Due to its simple mechanisms, a project checklist is unsuitable for large projects. It is like a short-term plan for projects that arise instantly.
Project checklists are an instant project management solution. A checklist can be considered the first step in building a project; however, a much more sophisticated tool is required for complicated processes.

The checklists help the team members to visualize the timeline of a task. They can get an idea about the resources needed for completing the project. Such a timely collection of resources will ensure a smooth workflow.
There are various types of checklists like to-do checklists, training checklists, task checklists, troubleshooting checklists, and coordination checklists. The team members can choose the type of checklist according to their project needs.
The project checklists can be made on paper or any device. They do not require technical assistance, and the team has to incur no cost.
Creating is the same as creating a list for your personal needs.
7. Mind Mapping
One of the most critical steps in any project planning is idea generation. Most teams prefer to have brainstorming sessions to facilitate idea generation.
Ideas do not come sequentially; they come as, and when something clicks, and just like that, they go if they aren’t stored properly.
Working in a creative field requires a long list of ideas. Using a tool like the Gantt chart that prefers linear projects in such organizations is not feasible. In such cases, Mind Map is the tool that works best.
A mind map is one of the best Gantt Chart Alternatives and a graphical representation of information to visualize the main idea.
It consists of a hierarchical framework that displays how different parts of the main idea are interrelated.
The process of making a mind map is uncomplicated. The first step is to draw the primary idea in the middle of the paper. Once this is done, draw branches connected to the main idea.
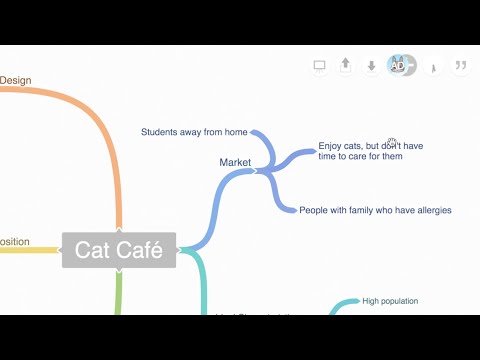
These branches can denote various sub-plans that can take place under the main idea. Drawing branches around the main idea helps widen the concept’s creative scope.
With enough branches, a theme can be developed for the project. The branches carry phrases, facts, figures, and keywords related to the project.
Mind maps are primarily suitable for creative projects and any other situation that requires generating new ideas at every stage. Mind mapping is an impactful method for generating ideas relating to day-to-day things.
It is a valuable tool for writers as it helps formulate a flexible strategy. Mind mapping helps visualize and keep track of even the tiniest details. It also assists in providing solutions that help make decisions.
✅FAQ on the alternatives to gantt chart list
What is the difference between PERT chart and Gantt chart?
Project planning and scheduling technologies include PERT and Gantt charts. Nevertheless, they serve various functions and offer various kinds of information.
PERT stands for Program Evaluation Review Technique. A project’s tasks, the time commitment for each work, and dependencies on other activities are all examined using this method.
This data is visually represented by a PERT chart, which displays tasks’ order and interdependencies. PERT charts are helpful for pinpointing potential bottlenecks and important paths in a project and calculating the overall time needed to finish it.
On the other hand, Gantt charts are used to schedule and track the progress of a project. Horizontal bars on a timeline represent the tasks that must be finished in a Gantt chart.
Each bar’s length indicates the task’s duration, and its location on the timeline indicates when it is scheduled to begin and end. Gantt charts can visualize a project’s progress, spot delays, and manage resources.
In conclusion, PERT charts are used to plan and analyze a project, whereas Gantt charts are used to schedule and monitor a project’s progress.
Why is PERT better than Gantt?
Given that they are used for different things and can be helpful tools in project management, it is not always accurate to declare one is better than the other. PERT and Gantt charts can provide a comprehensive picture of a project.
PERT charts can analyze a project’s tasks, the time needed for each task, and the dependencies between activities. They can be used to predict the overall time needed to finish the project and aid in the identification of potential bottlenecks and important pathways.
PERT charts are especially helpful for complicated projects with many interconnected tasks since they let you see the overall picture and comprehend how various tasks fit together.
Gantt charts, on the other hand, are helpful for planning and monitoring a project’s progress. They display the necessary tasks as horizontal bars on a timeline, with the length of each bar denoting the time required to accomplish the activity. Gantt charts can visualize a project’s progress, spot delays, and manage resources.
In conclusion, both PERT and Gantt charts can be helpful project management tools, but they serve different functions and can be used in conjunction to obtain a comprehensive picture of a project.
For your project’s unique requirements, selecting the appropriate tool is critical.
Do people still use Gantt charts?
Gantt charts are still used extensively in project management, yes. They are a quick and efficient way to see the project’s timeline, the tasks that need to be done, and the dependencies between them.
Because they make it easy to identify which activities have been finished and which are still in progress, Gantt charts are particularly helpful for planning and monitoring the progress of a project.
Gantt charts are frequently used alongside other project management techniques, such as PERT charts and critical path analysis, to obtain a comprehensive project picture.
They can help you see how various tasks fit together and spot potential bottlenecks or delays, which makes them very valuable for projects with many interconnected jobs.
Gantt charts can be produced manually with a spreadsheet or charting program or automatically with specialized project management software.
Gantt chart functionality is included in many project management software packages, allowing you to generate and modify Gantt charts as you work on a project.
Which is better network diagram or Gantt chart?
As they are used for different things and can both be helpful tools in project management, it is inaccurate to suggest that one is necessarily better. Gantt charts and network diagrams serve distinct purposes and can be used in tandem to provide a comprehensive view of a project.
The tasks involved in a project and their interdependencies are represented using network diagrams. They are especially helpful for examining how jobs are performed about one another, for determining a project’s critical path, and for locating potential bottlenecks.
Boxes or circles are used to represent tasks in network diagrams, while lines are used to highlight dependencies between activities.
Gantt charts, on the other hand, are used to plan and monitor a project’s progress. They display the necessary tasks as horizontal bars on a timeline, with the length of each bar denoting the time required to accomplish the activity. Gantt charts can visualize a project’s progress, spot delays, and manage resources.
In conclusion, network diagrams and Gantt charts can be helpful project management tools, but they serve different functions.
They can be used to provide a comprehensive understanding of a project. For your project’s unique requirements, selecting the appropriate tool is critical.
Conclusion on the Gantt chart alternatives list
The primary purpose of starting a business is to launch a product or service in the market. Organizations try to bridge the gap between their promises and consumers’ expectations.
Organizations should also focus on building better-quality products and delivering services at reasonable prices. This is only possible when the production team is clear with the planning of a product or service.
These Gantt Chart Alternatives help people in various departments to keep track of their work. These tools assist in making strategic plans that lead to the fulfillment of the organization’s objectives.
Therefore, it is crucial to choose the correct tool for project management. For large projects that involve many people, cross-functional charts can be the right choice.
On the other hand, if the project is small and does not deal with many details, then a simple project checklist will complete the work.