


Are you tired of constantly battling with dwindling disk space on your Linux system?💁
Have you ever wondered how to efficiently manage your storage and identify what’s taking up valuable capacity?
Look no further, as we bring you a comprehensive guide to mastering the Linux df command, the ultimate solution for disk space management.
In today’s digital age, where data is abundant and storage needs are ever-increasing, it’s crucial to have a powerful tool at your disposal to monitor and optimize disk space usage effectively.
Enter the df command—a command-line utility specifically designed for Linux systems that provides detailed insights into your file system and partitions.
In this article, we’ll dive deep into the world of the Linux df command, exploring its functionalities, various options, and practical use cases.
Whether you’re a Linux enthusiast, a system administrator, or simply someone seeking to unleash the full potential of your Linux machine, this guide will equip you with the knowledge and expertise to take control of your disk space management.
Throughout this article, we’ll demystify the df command, breaking down its syntax and explaining each component, allowing you to harness its power effortlessly.
We’ll walk you through a step-by-step approach to effectively analyze disk space utilization, interpret the results, and make informed decisions to optimize your storage.
So, if you’re ready to regain control of your Linux system’s disk space, join us as we embark on an enlightening journey to unlock the true potential of the Linux df command.
By the end of this guide, you’ll be equipped with the skills to manage your disk space efficiently, reclaim wasted storage, and ensure smooth operations for your Linux environment.
Let’s get started!
Uses of the df command in Linux:-

As mentioned earlier df command can do lots of things and in this section, we are going to use this command to do a few things and just witness the aptness of this command.
These commands are sorted in a manner where it is easy for a reader with different knowledge level to extract the juice out of
Note: All the commands that we are going to talk are case sensitive, therefore, you need to keep that in mind.
Must-Know:-
Before going on this journey, you need to know a few of the basic commands that should on top of your learning bucket list. So, here we go.
1. Ask Linux for guidance:-
Since Linux is a command based platform, therefore, the chances of you getting stuck amid mental chaos are high. So, Linux though of providing its users with a command with which they can ask for help.
Command: df –help
2. Show the Command Manual in Linux:-
If you are new in the world of Linux and its command then it is really beneficial for you to use this command to get the entire command Manual on your screen.
Command: man df
3. Show the Version Number
If you want to see the version number of the df command that’s installed on your computer then you might want to use the “-version” command with the df command to extract the version number.
Command: df –version
Beginners:-
If you are a newbie in this field then you need to know these commands first.
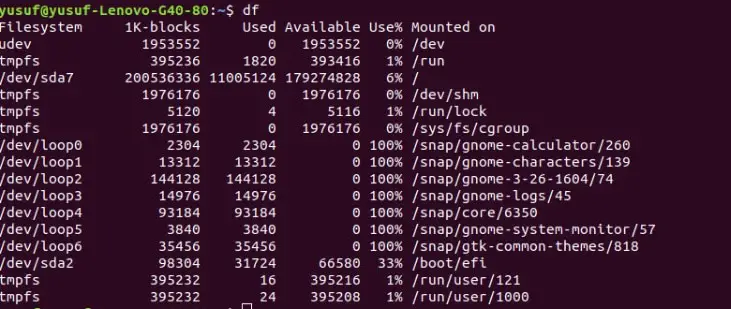
4. Check the Space of file system
Simple use of the “df” command can be used to determine a piece of decent information about each filesystem.
They were made to have a quick glance at your disk places as it uses just 1K block sizes. Therefore, If you want to see the amount of disk space that’s left and the amount that’s used then you should use this command.
Command: df
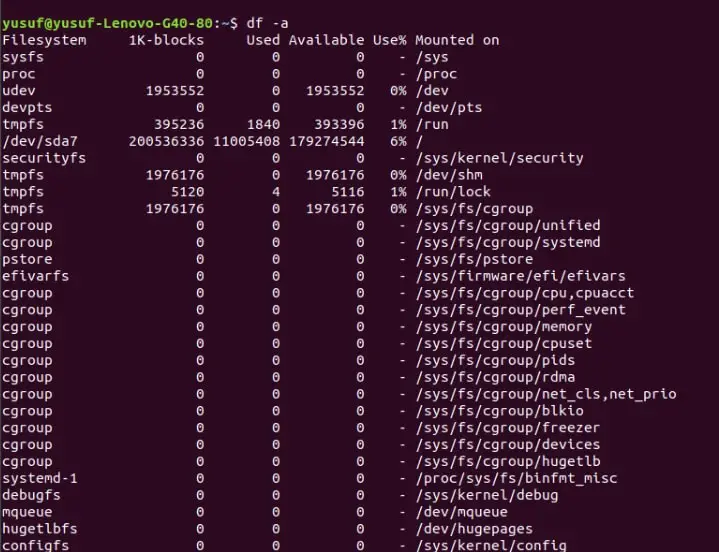
5. Check in-depth information of your disk
Even though you can extract some information about your disk with the help of the “df” command, but if you need to extract more information about your disk, you need to use “-a” or “–all” command.
Since this command is displaying all the file systems, therefore, it is regarded as a better alternative than the “df” command.
Command: df -a OR df –all
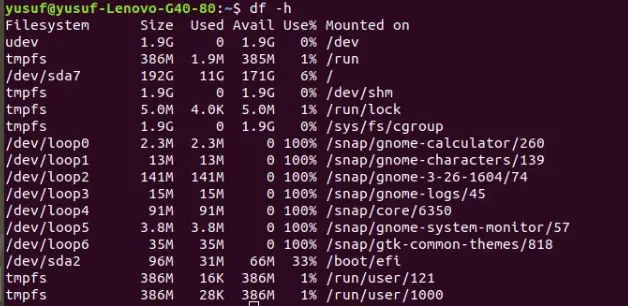
6. Display information in a human-friendly format
As mentioned earlier the “df” command displays the information in just 1K block size. The extracted information with this command is not very readable, therefore, Linux for the sake of its users introduced “-h” or “–human-readable”.
The information extracted by this command will always be larger than that extracted by the “-df” command as the average size of the information in the prior will fluctuate between MBs and GBs.
Command: df -h OR df –human-readable
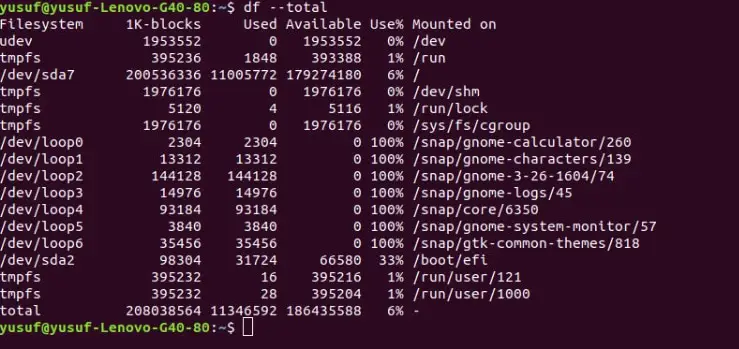
7. Extract complete information of Disk Storage
To extract a complete information guide about your Disk and the availability of the space, you might want to use the “-total” command. The best part about this command is that it has an entire row dedicated to the amount of disk space available and occupied space, namely total.
Command: df –total
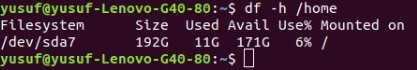
8. Get storage information of a particular file
Linux provides its users with an option to get information about a particular file as well. The information will be about the storage available and the storage occupied. To use that one needs to add “/name of the file” after any of the above options.
Note: One should use the human-readable format i.e; -h.
Command: df -h /home
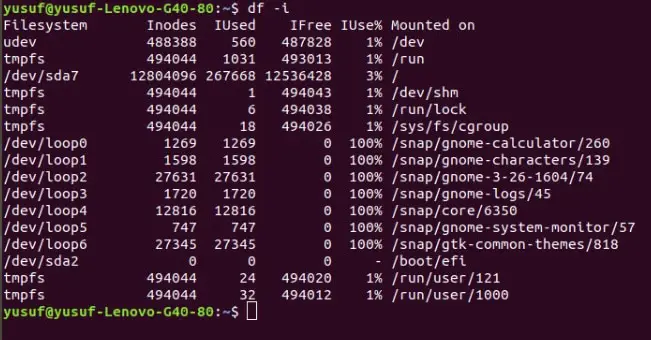
9. Display information about Inodes
Inode in Linux is used to explain the objects of filesystems, such as the files and directory. A “df” command with “-i” or “–inodes” can be used to do that. The information extracted by this command can be very useful to a user as it gives the data about mount-point, inodes, etc.
Command: df -i OR df –inodes.
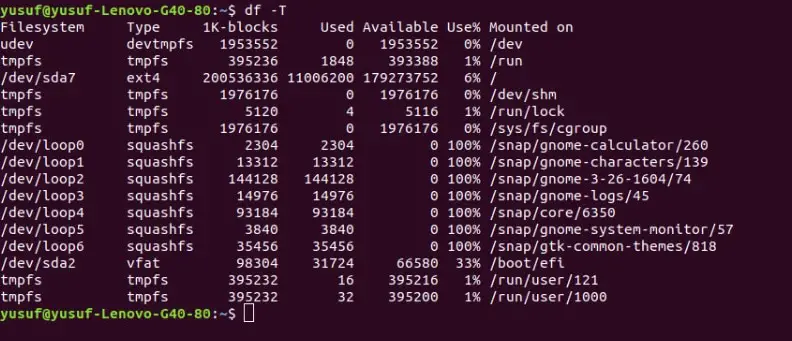
10. Display information of a particular filesystem type
Linus is blessed to have multiple types of filesystems. Every file system has a distinctive feature assigned to it. Some of the file systems are XFS, EXT3, EXT4, etc. If you want to see the type of the file type then use the “-T” or “–print-type” command.
Command: df -T or df –print-type
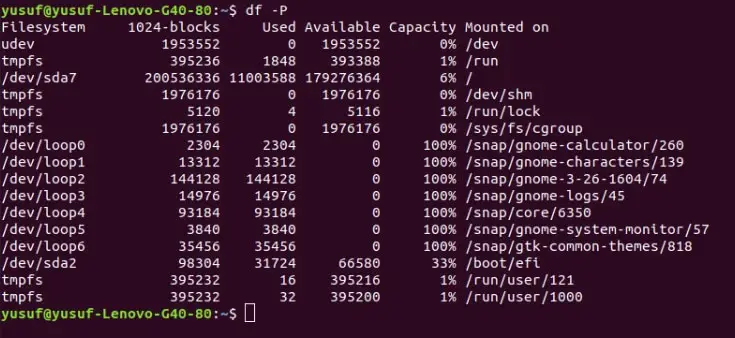
11. Show the details in POSIX
POSIX stands for Portable Operating System Interface, in this, the produced output will always support all the system build on Unix. So, in order to implement this command, one needs to add “-P” or “–portability” to the df command.
Command: df -P OR df –portable.
Intermediate:-
After learning the commands prescribed above in the beginner’s section, it’s time to increase the level by a notch. Here, we are going to discuss some practical uses of the commands discussed. So, here are a few commands that you should learn next.
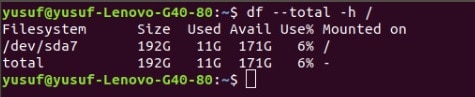
12. Extract detailed information about a specific disk in a human-readable manner
As mentioned earlier we are going to combine different commands to perform a specific task.
So, we are going to extract the total information of a disk at the same time, we will ensure that the information is user friendly. So, for that, we need to combine “total” and “h” command. Total being used to get the total information and “h” to make it human friendly.
Command: df –total -h /
13. Extract detailed information of all the partition in a human-readable format
To display the detailed information of all the partitions in a human-readable format we are going to combine “a” and “h” command, which are “view all” and “human-readable” in a single line of code. You can see the way we combined in the command below.
Command: df -ha OR df –human-readable –all
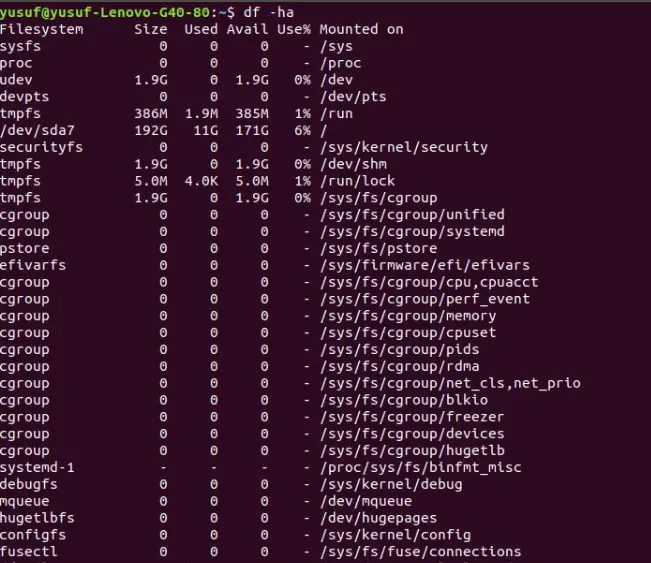
You can use any of them, the result will be the same.
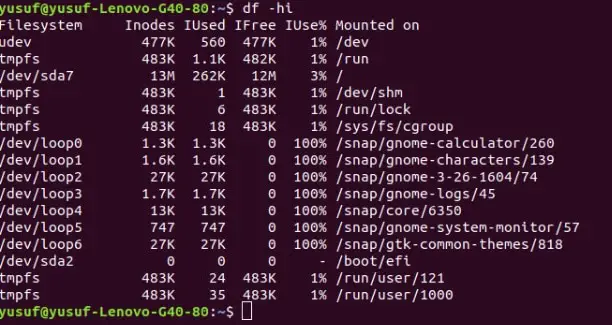
14. Display Inode information in a human-readable format
Inode as mentioned earlier is used to explain the objects of filesystems, such as the files and directory. So, to display inode information in a human-readable format.
We are going to combine both the command, “-i” and “h” which stands for inode and human-readable respectively.
Command: df -hi OR df –human-readable –inodes OR df -h -i
You can use any of them, the result will be the same.
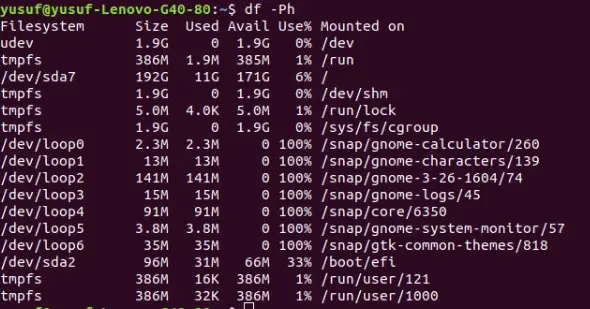
15. Display POSIX file in a human-readable format
POSIX stands for Portable Operating System Interface, in this, the produced output will always support all the system build on Unix.
If you want to get the POSIX file in a human-readable format you need to combine both the commands, “P” and “h” which stands for POSIX and human-readable respectively.
Commands: df -Ph OR df –portability –human-readable OR df -P -h
16. Exclude a particular file from the output
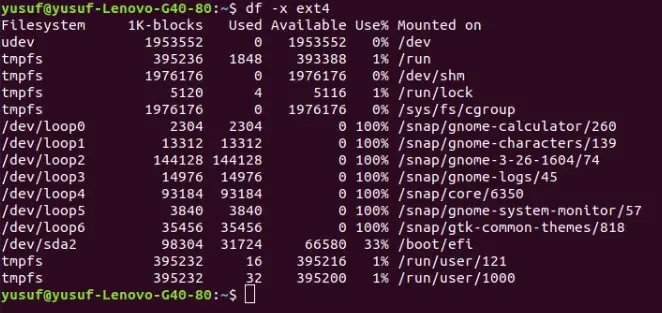
Linux provides its users with a feature where they can eliminate the result of a particular file system from their output. To do one need to combine “-x” and the file type which is “ext4” in this case, the command “-x” is used to eliminate a particular file system.
Command: df -x ext4 OR df -exclude -type=ext4
So now you won’t be able to see the output of the ext4 filetype. You can even add -h command if you want to make the output in a human-readable format.
17. Include a particular filetype to the output
Linux provides its users with a feature where they can include a particular file system to the output. To do that one needs to combine “-t” and the file type which is “ext4” in this case, the command “-t” is used to include a particular file system.
Command: df -t ext4 OR df type -type=ext4
So now you will be able to see the output of the ext4 filetype. You can even add -h command if you want to make the output in a human-readable format.
Advance:-
After knowing the commands discussed above in the article you will be able to do some tasks and with which you can learn more about Linux and the df command. But in this section, we are going to discuss a few more specific tasks. So, let’s see.
18.Display and Sort Information in POSIX format
The information that we get with the help of the commands discussed above is a hell of a mess.
Therefore, you might want to extract the information and sort it out and at the same time make sure that the information is in a human friendly, that’s the human-readable format. To do that, we are going to encapsulate the “P”, “sort” and “h” command.
Command: df -Ph | sort -nk5.
19. To see a filesystem’s Inode information
To see a filesystem’s Inode information we are going to add, “t”, “h”, “i” commands, and the file type. These commands stand for total info, human-readable, and inode information of the system respectively, and the file type we are choosing here is ext4.
Command: df -hi -t ext4
20. Use 1K block to display Disk Usage
As mentioned earlier the “df” command used to determine a piece of decent information about each filesystem. They were made to have a quick glance at your disk places as it uses just 1K block sizes.
We can obtain the same result with the help of the “-k” command which is a 1K command. The result that you will get after inserting this command is similar to that obtained by the “-h” command.
Command: df -k
21. Display Local FileSystem’s Inode Information
To display the local filesystem’s Inode information we are going to accumulate both the “i” and “-l” command in this code.
Command: df -li OR df –local –inodes
One thing that you should keep in mind that the output will not be very human-readable if you want to change it to that format then just add “-h” to the mix. Then your command will look something like.
Command: df -lih
22. Display a filesystem’s POSIX format
To display your filesystem’s information in Portable Operating System Interface then you need to add a lot of different commands, four to be specific. We are going to add “-P”,”-h”,”-T”,”-t”, and file type, which are Portable, human-readable, check the file type and total info respectively. Your command will look like…
Command: df -Ph -T -t ext4
23. To store the output
Linux allows its users to save output with the help of a very easy command. You need to add df_output to your already existing command. For example, if I want to store the output of my system’s inode information in a human-readable format your command will look like.
Command: df -hil > df_output
24. Show the usage of my disk in powers of 1000
More often than not, you will find your system using MBs and GBs, and its magnitude is represented in the power of 1024.
But if you are someone who wants to use Linux Shell Scripts to integrate disk checking commands, you might want to convert the usage of the disk in powers of 1000.
Command: df -H OR df –si
📗FAQ
How do I check disk space in Linux?
To check the disk space in Linux, you can use the “df” command. This command displays information about the available and used space on all mounted file systems. You can also use the “-h” option with the “df” command to display the disk space in a human-readable format.
Why is df and du different?
The “df” and “du” commands are different because they report disk usage in different ways. The “df” command shows the total disk space used and available for an entire file system, whereas the “du” command shows the disk space used by each file and directory within a specified directory.
Therefore, the “df” command provides information about the overall disk usage of a file system, while the “du” command provides information about the disk usage of individual files and directories.
What is the difference between df and du commands?
The main difference between the “df” and “du” commands is that “df” displays information about the overall disk space usage of a file system, while “du” displays the disk usage of individual files and directories.
Additionally, the “df” command provides information about the total disk space used and available for each file system, while the “du” command shows the disk space used by each file and directory within a specified directory.
How to clean disk in Linux?
To clean disk space in Linux, you can delete unnecessary files and directories, uninstall unused software, and clear out log files. The “du” command can help you identify large files and directories that are taking up a lot of disk space.
You can also use the “rm” command to delete files and directories that are no longer needed. Be careful when using the “rm” command, as it can permanently delete files and directories.
How do I check disk space and RAM in Linux?
You can check disk space and RAM in Linux by using the “df” command to check disk space usage and the “free” command to check RAM usage.
The “free” command displays information about the total and used RAM, as well as the available RAM.
How do I check my disk space?
You can check your disk space in Linux by using the “df” command. This command displays information about the available and used space on all mounted file systems.
What is df H command?
The “df -h” command is used to display disk space usage in a human-readable format. The “-h” option stands for “human-readable” and displays disk space usage in units that are easier for humans to understand, such as “MB” and “GB”.
What df means in Linux?
In Linux, “df” stands for “disk free”. The “df” command is used to display information about the available and used disk space on all mounted file systems.
Why does df show bigger disk usage than du?
The “df” command shows a bigger disk usage than the “du” command because “df” reports the total disk space used and available for an entire file system, including the space used by files that have been deleted but are still open by running processes. In contrast, “du” reports the disk space used by each file and directory within a specified directory, excluding the space used by deleted files that are still open.
What is the alternative to df in Linux?
The alternative to the “df” command in Linux is the “lsblk” command. The “lsblk” command displays information about all available block devices, including disk usage and partition information.
What is the difference between fdisk and df?
The main difference between “fdisk” and “df” is that “fdisk” is used for disk partitioning, while “df” is used to display information about the available and used disk space on mounted file systems.
“fdisk” is used to create, delete, and modify disk partitions, while “df” is used to check the disk space usage of the file systems that are mounted on those partitions.
What is netstat command in Linux?
The “netstat” command in Linux is used to display information about network connections and network statistics. It shows information about open sockets, routing tables, and network interface statistics.
How to fix corrupted disk in Linux?
You can use the “fsck” command to fix a corrupted disk in Linux. This command checks and repairs the file system on a disk. You should unmount the disk before running the “fsck” command to avoid data corruption.
How do I delete unnecessary files in Linux?
You can use the “rm” command to delete unnecessary files in Linux. The “rm” command is used to delete files and directories. Be careful when using the “rm” command, as it can permanently delete files and directories.
What happens if root filesystem is full?
If the root filesystem in Linux becomes full, the system may become unstable and stop functioning properly. This can cause applications to crash, system errors to occur, and the system to become unresponsive.
To prevent this from happening, it’s important to monitor disk space usage and clean up unnecessary files and directories regularly.
What is the du command in Linux?
The du command in Linux is used to estimate the file space usage in a directory. It is commonly used to find out which directories or files are consuming the most disk space on a system.
Why does du and df show different results?
The du command displays the disk usage of a directory or file, whereas the df command shows the disk space available on the file system. As a result, du and df can show different results because they are measuring different things.
How to use df command in Linux?
To use the df command in Linux, open the terminal and type “df -h” to display the disk usage information for all mounted file systems in a human-readable format.
What is the difference between Lsblk and df command in Linux?
The lsblk command in Linux displays the block devices (disks and partitions) connected to the system, while the df command shows the available disk space on file systems. In other words, lsblk displays the hardware, while df shows the software.
Why use du command in Linux?
The du command in Linux is used to identify directories or files that are consuming large amounts of disk space. This information is helpful when trying to optimize disk usage, identify potential storage issues, or free up disk space.
How to use du in Linux?
To use the du command in Linux, open the terminal and type “du -h” followed by the directory or file you want to analyze. This will display the disk usage of that directory or file in a human-readable format.
What is the df command in Unix?
The df command in Unix is used to display the available disk space on a file system. It is similar to the df command in Linux.
What is filesystem in Linux?
In Linux, a filesystem is a hierarchy of directories and files used to store and organize data on a storage device. The most commonly used filesystem in Linux is the ext4 filesystem.
How do I find missing disk space in Linux?
To find missing disk space in Linux, you can use the du command to identify which directories or files are using the most disk space, and then investigate further to determine the cause of the missing disk space.
How do I check storage on Linux?
To check storage on Linux, you can use the df command to display the available disk space on a file system, or the lsblk command to display the block devices connected to the system.
How do I check memory in Linux?
To check memory in Linux, you can use the free command to display the amount of free and used memory on the system.
How do I see storage usage in Linux?
To see storage usage in Linux, you can use the du command to display the disk usage of a directory or file, or the df command to display the available disk space on a file system.
How do I tell the difference between a file and a directory in Linux?
In Linux, a file is a collection of data stored in a single unit, while a directory is a container for files and other directories.
To tell the difference between a file and a directory in Linux, you can use the ls command to list the contents of a directory. Directories will be indicated with a “d” in the first column.
What is the difference between ls and du command?
The ls command is used to list the contents of a directory, while the du command is used to estimate the file space usage in a directory or file. In other words, ls shows the names of files and directories, while du shows the amount of disk space they are using.
Linux df command options
Here are some common options that can be used with the df command:
-h: This option displays the sizes in a “human-readable” format, which means the sizes will be displayed in units such as “KB”, “MB”, “GB”, etc.
-T: This option adds an additional column to the output that displays the file system type.
-i: This option displays information about the inode usage instead of the disk usage.
-a: This option displays information about all file systems, including those that are normally hidden.
-t: This option filters the output to only show file systems that match a specific type. For example, you can use -t ext4 to only show ext4 file systems.
-x: This option excludes specific file systems from the output. For example, you can use -x tmpfs to exclude tmpfs file systems.
-P: This option forces the output to be displayed in a single line, which can be useful for scripting.
--total: This option adds a final line to the output that shows the total disk space used and available across all file systems.
Conclusion
In conclusion, the Linux df command stands as a powerful tool for efficiently managing disk space and gaining valuable insights into file system usage.
By incorporating this versatile command into your Linux administration repertoire, you can effortlessly monitor disk utilization, identify space-hogging files or directories, and make informed decisions to optimize your storage resources.
With its straightforward syntax and extensive range of options, the df command empowers users to delve deep into their file systems, extract vital information, and take appropriate actions.
Whether you’re a system administrator, a developer, or an enthusiast, leveraging the df command enables you to maintain the health and performance of your Linux systems while maximizing storage efficiency.
By using the df command, you gain the ability to track disk space consumption, identify potential issues, and implement proactive measures to prevent data loss or system instability.
This command provides an invaluable resource for troubleshooting disk-related problems, allowing you to swiftly pinpoint and address space constraints, avoid bottlenecks, and ensure the smooth operation of your Linux environment.
In summary, the Linux df command serves as an indispensable tool in managing disk space effectively.
By mastering its usage, you can harness the power of accurate and real-time disk usage information to optimize your Linux systems, improve overall performance, and maintain a streamlined and efficient file system.
Embrace the capabilities of the df command and unlock the full potential of your Linux-based infrastructure.