


In today’s fast-paced digital landscape, where software applications have become integral to business operations, monitoring your application is paramount.
Whether you’re running a small startup or managing a large enterprise, effectively monitoring your application can make a significant difference in performance, reliability, and user experience.
By keeping a vigilant eye on your application’s health and performance, you can identify and address issues promptly, ensuring smooth operation and maximizing the value delivered to your users.
In this article, we will explore the key reasons why monitoring your application is important and how it can positively impact your business.
What is Application Monitoring?🤷♂️
Application monitoring refers to systematically observing, measuring, and analyzing various aspects of an application’s behavior, performance, and health.
It involves capturing and interpreting data related to application metrics, user interactions, system resources, and network connectivity, among other factors. By diligently monitoring applications, organizations gain valuable insights into their performance, availability, and user experience.
These insights enable timely detection and resolution of issues, proactive optimization, and informed decision-making.
Why Monitoring Your Application is Important
Monitoring your application allows you to detect and resolve performance bottlenecks, identify security vulnerabilities, and optimize resource utilization.
By watching your application’s health, you can proactively address potential issues before they escalate, ensuring high availability and reliability. Comprehensive application monitoring lets you analyze critical metrics such as response time, throughput, error rates, and resource consumption.
You can better understand your application’s behavior and performance patterns with real-time insights into these factors. With this knowledge, you can make informed decisions to enhance the overall user experience, optimize server infrastructure, and improve business outcomes.
Furthermore, application monitoring helps you stay ahead of the competition by enabling continuous improvement and innovation. By monitoring user interactions and gathering data on usage patterns, you can identify opportunities for feature enhancements and tailor your application to meet evolving user needs.
Let’s delave the why monitoring you application is important point in more details:-
1. Performance Optimization and User Experience Enhancement
Application monitoring allows organizations to examine their applications’ performance in real-time closely. By tracking metrics such as response times, throughput, and error rates, organizations can identify performance bottlenecks and areas for improvement.
With this information, they can fine-tune their applications to deliver an optimal user experience, ensuring responsiveness, stability, and usability.
2. Early Issue Detection and Rapid Resolution
Proactively monitoring applications enables the early detection of potential issues, such as errors, crashes, or performance degradation.
By implementing monitoring tools that provide alerts and notifications, organizations can promptly identify and address these issues before they escalate, minimizing downtime and user impact. Early issue detection and rapid resolution contribute to improved application stability and reliability.
3. Capacity Planning and Scalability
Application monitoring provides valuable data for capacity planning and scalability. Organizations can identify potential capacity constraints by analyzing resource utilization and making informed decisions regarding infrastructure upgrades or adjustments.
Monitoring helps organizations ensure their applications handle increasing user loads or sudden traffic spikes without compromising performance or availability.
4. Security and Compliance
In the context of application monitoring, security is a crucial aspect. Monitoring allows organizations to detect and respond to security incidents promptly.
By monitoring for unauthorized access attempts, anomalous behavior, or suspicious network traffic, organizations can identify potential security breaches and take immediate action to mitigate risks. This helps protect sensitive data, maintain regulatory compliance, and safeguard the reputation and trust of users.
5. Cost Optimization
Efficient application monitoring facilitates cost optimization by providing insights into resource utilization patterns.
Organizations can identify inefficiencies or areas of potential waste by monitoring metrics such as CPU usage, memory consumption, or storage utilization. This allows for fine-tuning resource allocation, optimizing infrastructure costs, and ensuring optimal performance without unnecessary expenditure.
In conclusion, monitoring your application is indispensable for any organization aiming to deliver a robust and reliable digital experience. By prioritizing application monitoring, you can achieve optimal performance, maximize uptime, enhance security, and stay ahead of the curve in the ever-evolving digital landscape.
Application Monitoring Approaches and Techniques
To achieve comprehensive application monitoring, organizations employ a variety of approaches and techniques depending on their specific requirements and the nature of their applications.
Here are some commonly used techniques:
1. Log Monitoring
Log monitoring involves collecting and analyzing log files an application or its underlying infrastructure generates. Logs provide valuable information about system events, errors, warnings, and user activities. By monitoring logs, organizations can gain insights into application behavior, diagnose issues, and track application performance over time.
2. Performance Monitoring
Performance monitoring focuses on capturing and analyzing application performance metrics. This includes response times, CPU and memory utilization, network latency, and database query performance.
Performance monitoring tools provide real-time visibility into these metrics, helping organizations identify performance bottlenecks, optimize resource allocation, and ensure a seamless user experience.
3. Real User Monitoring (RUM)
Real User Monitoring involves real-time tracking and analyzing user interactions with an application. RUM captures page load times, click-through rates, and user session durations. By monitoring actual user experiences, organizations gain insights into the performance and usability of their applications from the user’s perspective, enabling them to prioritize enhancements and optimize user satisfaction.
4. Synthetic Monitoring
Synthetic monitoring involves simulating user interactions with an application by generating artificial transactions. These transactions, often performed from different geographical locations, allow organizations to monitor application availability, performance, and functionality proactively.
Synthetic monitoring helps identify issues before they impact real users and provides valuable insights for performance optimization.
5. Error Monitoring
Error monitoring captures and analyzes application errors, exceptions, and crashes. Organizations can identify recurring or critical errors by monitoring error logs, prioritizing bug fixes, and enhancing application stability.
Error monitoring tools provide valuable information for developers, allowing them to quickly pinpoint issues and improve the overall quality of the application.
How to Choose a Web Application Monitoring Tool
Choosing the right web application monitoring tool is essential for organizations aiming to ensure optimal performance, availability, and user experience of their web applications.
With numerous options available in the market, navigating through the choices can be a daunting task. However, considering several key factors, you can make an informed decision when selecting a web application monitoring tool that aligns with your needs.
1. Comprehensive Monitoring Capabilities
When choosing a web application monitoring tool, it’s crucial to prioritize comprehensive monitoring capabilities. Look for a tool that can effectively track and analyze key metrics such as response times, uptime, error rates, and user interactions. This allows you to gain real-time visibility into the performance of your web application, enabling prompt detection and resolution of any issues that may arise.
2. Scalability and Flexibility
Consider the scalability and flexibility of the monitoring tool. It should be capable of handling your current application requirements while also accommodating future growth.
Look for features such as distributed monitoring, which enables monitoring from multiple locations, and the ability to monitor multiple applications simultaneously. Ensure the tool supports different programming languages and frameworks commonly used in your web application development.
3. User-Friendly Interface and Ease of Use
The usability of the monitoring tool is another critical factor to consider. Look for a tool that provides an intuitive and user-friendly interface. The setup process should be straightforward, allowing you to configure monitoring parameters quickly. Visualizations and reports should be clear and easy to interpret, providing actionable insights into the performance of your web application.
4. Customization and Configuration
Different web applications have unique monitoring requirements. Therefore, choosing a tool with sufficient customization and configuration options is essential.
Look for features such as customizable dashboards and the ability to set alert thresholds based on your specific needs. The tool should also allow you to configure monitoring checks based on various user scenarios to ensure comprehensive coverage.
5. Integration and Compatibility
Consider the compatibility of the monitoring tool with your existing infrastructure and technology stack. It should seamlessly integrate with your web server, databases, cloud platforms, and other relevant components.
Look for API support to integrate with other tools and systems used in your organization’s monitoring and management processes. Compatibility with popular web frameworks and platforms is also a crucial consideration.
6. Robust Analytics and Reporting
An effective web application monitoring tool should provide robust analytics and reporting capabilities. It should offer detailed insights into the performance of your web application, user behavior, and resource utilization.
Advanced features such as anomaly detection and predictive analytics can help identify potential issues before they impact your users. The tool should also offer customizable reports and the ability to schedule automated report generation for easy analysis and sharing.
7. Security and Compliance Features
Security is a paramount concern when it comes to web application monitoring. Ensure that the tool you choose has robust security features in place.
Look for secure data transmission, encryption, and access controls to protect sensitive information. If your web application handles sensitive data or falls under specific compliance regulations, verify that the monitoring tool meets the necessary compliance standards.
8. Pricing and Return on Investment
Consider the pricing structure and licensing models offered by the monitoring tool. Evaluate the total cost of ownership, including any additional fees for support or upgrades.
Assess the potential return on investment by considering the tool’s value in improved application performance, reduced downtime, and enhanced user satisfaction. Balance the cost with the features and benefits offered to ensure a favorable return on your investment.
By considering these factors, you can select a web application monitoring tool that suits your organization’s needs and helps you effectively monitor and optimize the performance of your web applications.
Remember, each organization has unique requirements, so take the time to evaluate different options and choose a tool that aligns with your specific goals and objectives.
Best Web Application Monitoring Tools
1. Dynatrace
Dynatrace is a cutting-edge, AI-powered application monitoring platform that empowers organizations to achieve unprecedented visibility and control over their complex IT ecosystems.
With its advanced capabilities and innovative features, Dynatrace revolutionizes how businesses monitor and optimize their applications.
At the heart of Dynatrace lies its powerful AI engine, which leverages machine learning algorithms to automatically detect and analyze performance anomalies, bottlenecks, and potential issues within your applications.
By monitoring every aspect of your application stack in real time, from the infrastructure to the code level, Dynatrace provides holistic insights into the entire delivery chain.
Dynatrace goes beyond traditional monitoring solutions, offering comprehensive features encompassing end-user experience monitoring, root cause analysis, and cloud infrastructure monitoring.
This holistic approach allows businesses to pinpoint the exact sources of issues, ensuring rapid troubleshooting and minimizing the impact on user experience.
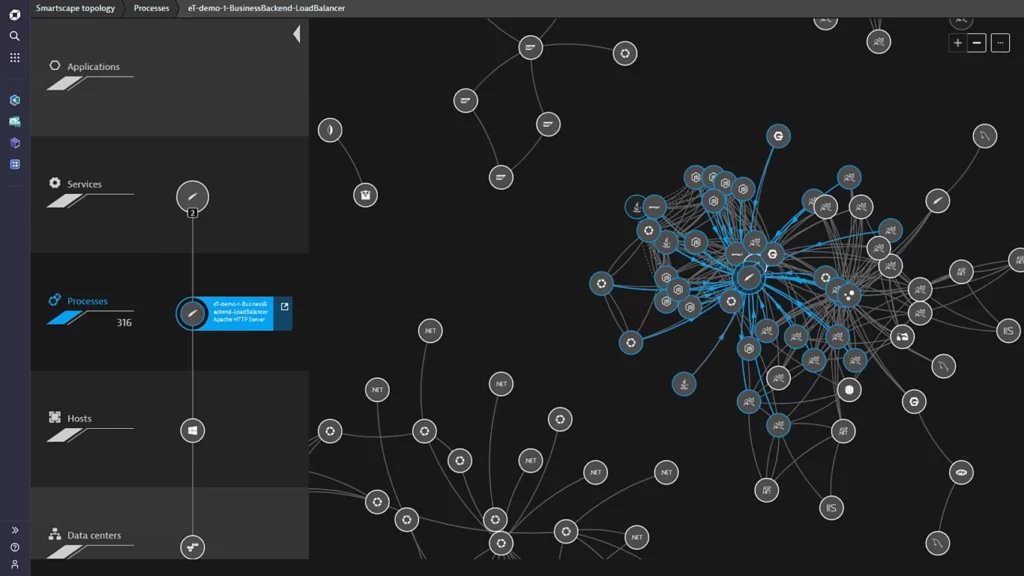
One of the standout features of Dynatrace is its ability to automatically map the entire application architecture, visualizing the relationships and dependencies between various components. This enables organizations to clearly understand how each element contributes to the overall performance and helps optimize resource allocation.
Furthermore, Dynatrace excels in providing intelligent insights based on collected data. It leverages advanced analytics to identify patterns, trends, and opportunities for optimization.
With the help of Dynatrace, businesses can make data-driven decisions and take proactive measures to enhance application performance, ensure scalability, and improve overall customer satisfaction.
In conclusion, Dynatrace sets the benchmark for intelligent application monitoring. Its advanced AI capabilities, comprehensive feature set, and deep insights enable organizations to gain unprecedented control over their application environments.
By leveraging the power of Dynatrace, businesses can drive innovation, enhance user experience, and maximize their digital success.
Pros of Dynatrace:-
Advanced AI-Powered Monitoring: Dynatrace’s AI engine offers powerful automatic anomaly detection and analysis capabilities, providing real-time insights into application performance.
Comprehensive Visibility: Dynatrace provides end-to-end visibility across the entire application stack, from infrastructure to code level, enabling businesses to understand the complete delivery chain and identify performance bottlenecks.
Intelligent Root Cause Analysis: With its AI-driven root cause analysis, Dynatrace helps businesses quickly pinpoint the sources of issues, reducing mean time to resolution and minimizing the impact on user experience.
Automatic Application Mapping: Dynatrace automatically maps the application architecture, visually representing component relationships and dependencies and facilitating optimization efforts.
Data-Driven Insights: Dynatrace’s advanced analytics capabilities enable businesses to gain intelligent insights from collected data, identifying patterns, trends, and opportunities for optimization.
Cons of Dynatrace:-
Complex Configuration: Setting up and configuring Dynatrace for complex application environments can be challenging, requiring expertise and time to fine-tune the monitoring settings.
Steep Learning Curve: The advanced features and terminology used in Dynatrace may require a learning curve for users unfamiliar with the platform, potentially requiring training or support.
Cost Considerations: Dynatrace’s comprehensive feature set comes at a cost, which may be a factor for smaller businesses or organizations with limited budgets.
Dependency on Agent Installation: To monitor applications effectively, Dynatrace requires agents to be installed on each application component, which can be a time-consuming process, especially for large-scale environments.
Limited Customization: While Dynatrace offers extensive monitoring capabilities, some users may find limitations in customizing certain platform aspects to meet specific requirements.
2. Datadog
Datadog APM is a powerful and comprehensive Application Performance Monitoring (APM) solution that empowers organizations to gain deep insights into the performance of their applications.
With its advanced features and cutting-edge technology, Datadog APM helps businesses optimize their application performance and deliver exceptional user experiences. Datadog APM’s core lies in its ability to monitor, trace, and analyze every aspect of an application’s performance.
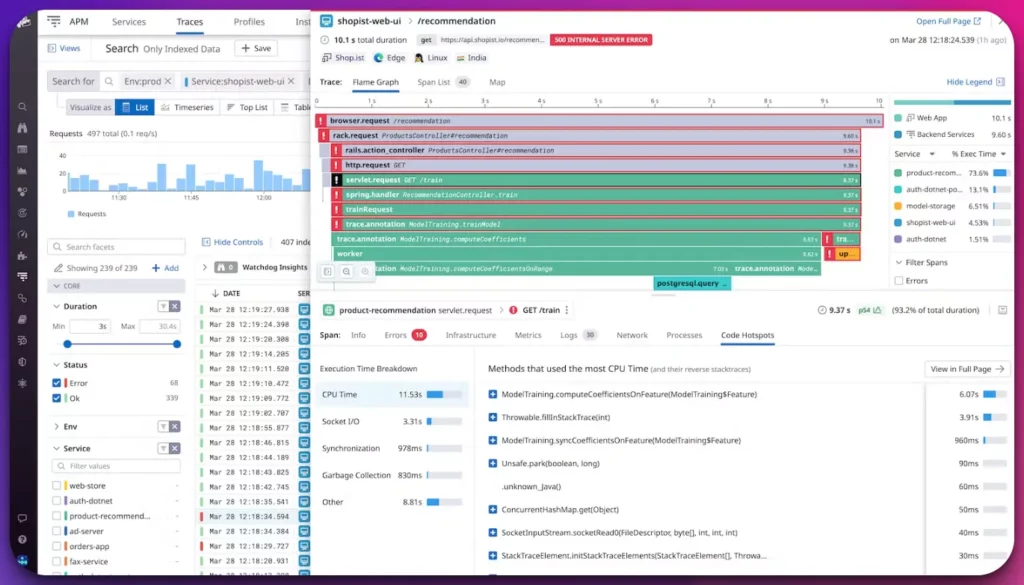
By collecting and analyzing data from various sources, Datadog APM provides detailed visibility into application behavior, including response times, throughput, error rates, and resource utilization.
With Datadog APM, businesses can easily identify performance bottlenecks and inefficiencies, allowing them to diagnose and resolve issues quickly.
The platform offers distributed tracing, enabling end-to-end visibility of requests as they traverse various application components, making identifying latency or error sources easier.
One of the standout features of Datadog APM is its ability to detect anomalies and provide smart alerts automatically. Through machine learning algorithms, it can identify unusual patterns or deviations in performance metrics, enabling proactive identification and resolution of potential issues.
Furthermore, Datadog APM seamlessly integrates with other monitoring tools and platforms, providing a unified view of application performance alongside infrastructure metrics, logs, and user experience data. This holistic approach allows businesses to correlate performance insights and comprehensively understand their entire ecosystem.
In conclusion, Datadog APM is a game-changer in application performance monitoring. Its robust capabilities, including monitoring, tracing, and anomaly detection, enable organizations to optimize their applications, deliver exceptional user experiences, and drive business success.
With Datadog APM, businesses can stay one step ahead by proactively managing and improving their application performance.
Pros of Datadog APM:-
Comprehensive Application Monitoring: Datadog APM offers a wide range of monitoring capabilities, providing deep insights into application performance, response times, and resource utilization.
Distributed Tracing: The platform’s distributed tracing feature allows businesses to trace requests as they move through various application components, facilitating the identification of latency or error sources.
Automatic Anomaly Detection: Datadog APM leverages machine learning algorithms to detect anomalies and deviations in application performance, enabling proactive identification and resolution of potential issues.
Seamless Integration: Datadog APM integrates seamlessly with other monitoring tools and platforms, providing a unified view of application performance alongside infrastructure metrics, logs, and user experience data.
Scalability: Datadog APM is designed to handle large-scale application environments, making it suitable for businesses of all sizes and supporting growth without compromising performance.
Cons of Datadog APM:-
Learning Curve: The extensive features and functionality of Datadog APM may present a learning curve for new users, requiring time and training to fully utilize the platform’s capabilities.
Cost Considerations: Datadog APM is a premium solution, and the pricing may be a factor for small or budget-constrained organizations.
Complex Configurations: Setting up and configuring Datadog APM for complex application environments can be complex, and organizations may require dedicated resources or technical expertise.
Limited Customization: While Datadog APM offers a comprehensive set of features, some users may find limitations in customizing certain platform aspects to meet specific requirements.
Agent Installation: Datadog APM requires agents to be installed on application components, which can be time-consuming, especially for large-scale environments.
Considering these pros and cons in the context of your specific needs and requirements is important. Evaluating Datadog APM against your organization’s goals and infrastructure will help determine if it fits your application monitoring needs correctly.
3. New Relic
New Relic is a leading Application Performance Monitoring (APM) platform that empowers businesses to gain comprehensive insights into the performance and health of their applications.
With its advanced features and innovative technology, New Relic enables organizations to optimize application performance, deliver exceptional user experiences, and drive digital success. New Relic’s core lies in its ability to monitor, analyze, and optimize every aspect of an application’s performance.
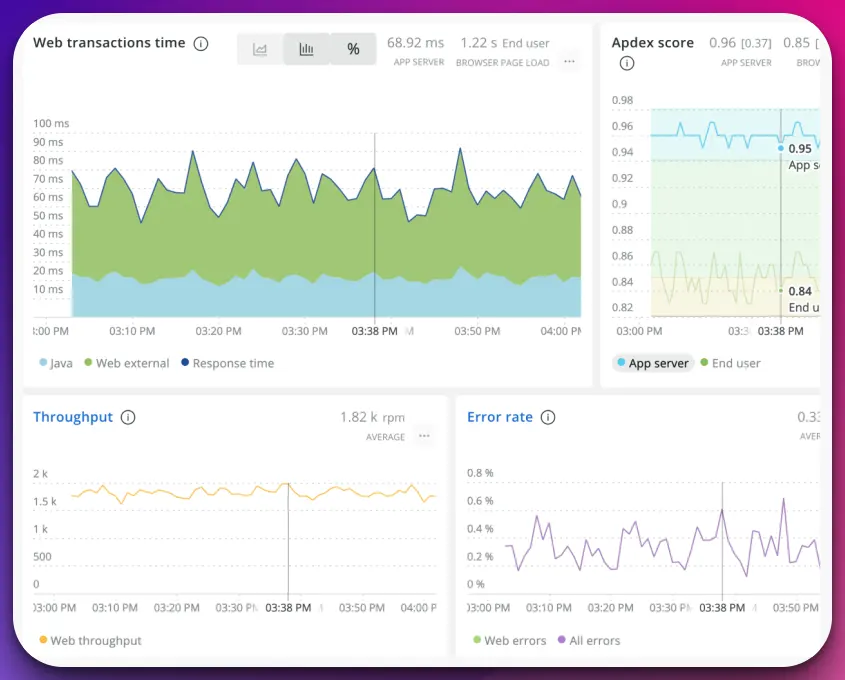
By collecting and analyzing data from various sources, New Relic provides deep visibility into application behavior, including response times, throughput, errors, and resource utilization.
One of the standout features of New Relic is its real-time monitoring, which enables businesses to detect and resolve issues as they occur, minimizing downtime and ensuring optimal user experiences.
The platform offers code-level diagnostics and transaction tracing, allowing organizations to pinpoint performance bottlenecks and optimize their application code. With New Relic, businesses can gain insights into end-user experiences through real-user monitoring (RUM).
This feature captures user interactions, providing valuable data on page load times, browser performance, and overall user satisfaction.
Moreover, New Relic offers scalable and flexible solutions that cater to organizations of all sizes. New Relic provides the tools and analytics needed to monitor and optimize performance, whether a small-scale application or a complex enterprise system.
In conclusion, New Relic is a game-changer in application performance monitoring. Its advanced features, including real-time monitoring, code-level diagnostics, and end-user experience insights, empower organizations to optimize their applications, deliver exceptional user experiences, and achieve digital excellence.
With New Relic, businesses can unlock the true potential of their applications and stay ahead in today’s competitive digital landscape.
Pros of New Relic:-
Comprehensive Application Monitoring: New Relic provides a comprehensive suite of monitoring tools that offer deep insights into application performance, allowing businesses to identify and address performance bottlenecks.
Real-Time Monitoring: The platform offers real-time monitoring capabilities, enabling businesses to detect and resolve issues as they occur, minimizing downtime, and ensuring optimal user experiences.
Code-Level Diagnostics: New Relic allows organizations to dive into application code to identify performance issues at the code level, helping developers optimize their code for better performance.
End-User Experience Insights: With real-user monitoring (RUM), New Relic captures data on user interactions, page load times, and browser performance, providing valuable insights into the end-user experience.
Scalable Solutions: New Relic offers scalable solutions suitable for organizations of all sizes, whether a small-scale application or a complex enterprise system, allowing businesses to grow and adapt their monitoring needs.
Cons of New Relic:-
Complex Configuration: Setting up and configuring New Relic for complex application environments requires technical expertise and time for optimal setup.
Cost Considerations: New Relic is a premium solution, and the pricing may be a factor for small or budget-constrained organizations.
Learning Curve: The extensive features and capabilities of New Relic may present a learning curve for new users, requiring time and training to utilize the platform’s potential fully.
Limited Customization: While New Relic offers a wide range of monitoring capabilities, some users may find limitations in customizing certain platform aspects to meet specific requirements.
Dependency on Agent Installation: New Relic requires agents to be installed on application components, which can be time-consuming, especially for large-scale environments, and may impact deployment processes.
4. AppDynamics
AppDynamics is a leading Application Performance Management (APM) platform that empowers businesses to gain unparalleled visibility into the performance and health of their applications.
With its advanced features and innovative technology, AppDynamics enables organizations to optimize application performance, enhance user experiences, and drive digital success. At the heart of AppDynamics is its ability to monitor, analyze, and optimize every aspect of an application’s performance.
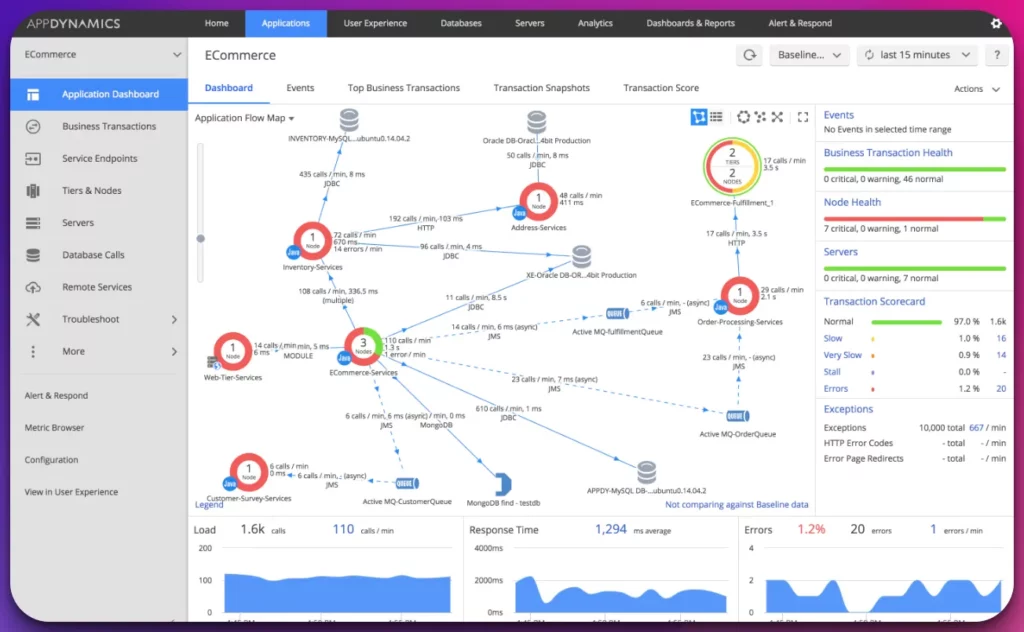
By capturing real-time data from various sources, AppDynamics provides deep insights into application behavior, including response times, transaction performance, errors, and resource utilization.
One of the standout features of AppDynamics is its powerful business transaction monitoring capability, which allows organizations to track and analyze critical transactions within their applications. This feature provides granular visibility into transaction performance, helping businesses identify bottlenecks, optimize code, and enhance overall application efficiency.
With AppDynamics, businesses can proactively identify and address performance issues through real-time monitoring and advanced diagnostics.
The platform’s intelligent alerting system helps organizations detect anomalies, deviations, and potential issues, enabling swift remediation and minimizing any negative impact on the user experience.
Furthermore, AppDynamics provides end-to-end visibility into complex application ecosystems, allowing businesses to monitor and optimize the performance of distributed systems, microservices, and cloud-native architectures.
This capability ensures that organizations can effectively manage and optimize the performance of modern, highly dynamic applications.
In conclusion, AppDynamics is a game-changer in application performance management. Its advanced features, including business transaction monitoring, real-time monitoring, and end-to-end visibility, empower organizations to optimize application performance, deliver exceptional user experiences, and achieve digital excellence.
With AppDynamics, businesses can unlock the full potential of their applications and stay ahead in the rapidly evolving digital landscape.
Pros of AppDynamics:-
Comprehensive Application Monitoring: AppDynamics offers a comprehensive suite of monitoring tools that provide deep insights into application performance, allowing businesses to proactively identify and resolve performance issues.
Business Transaction Monitoring: AppDynamics excels in tracking and monitoring critical business transactions within applications, offering granular visibility into transaction performance and helping optimize code and improve overall efficiency.
Real-Time Monitoring and Advanced Diagnostics: With real-time monitoring and advanced diagnostics, AppDynamics enables organizations to detect anomalies and deviations in application performance, allowing for swift remediation and minimizing user experience disruptions.
End-to-End Visibility: AppDynamics provides end-to-end visibility into complex application ecosystems, including distributed systems, microservices, and cloud-native architectures, allowing businesses to manage and optimize performance in modern environments effectively.
Scalability and Adaptability: AppDynamics offers scalable solutions suitable for businesses of all sizes, providing flexibility to adapt to evolving application needs.
Cons of AppDynamics:-
Complex Configuration: Setting up and configuring AppDynamics for complex application environments requires technical expertise and time for optimal setup.
Learning Curve: The advanced features and capabilities of AppDynamics may present a learning curve for new users, requiring time and training to fully utilize the platform’s potential.
Cost Considerations: AppDynamics is a premium solution, and the pricing may be a factor for small or budget-constrained organizations.
Dependency on Agent Installation: AppDynamics requires agents to be installed on application components, which can be time-consuming, especially for large-scale environments, and may impact deployment processes.
Limited Customization: While AppDynamics offers extensive monitoring capabilities, some users may find limitations in customizing certain platform aspects to meet specific requirements.
5. SolarWinds AppOptics
SolarWinds AppOptics is an advanced and comprehensive cloud-native monitoring solution that empowers businesses to gain deep visibility into the performance and health of their applications.
With its cutting-edge features and innovative technology, SolarWinds AppOptics revolutionizes how organizations monitor and optimize their cloud-based applications. At the core of SolarWinds AppOptics is its ability to provide infrastructure and application performance monitoring.
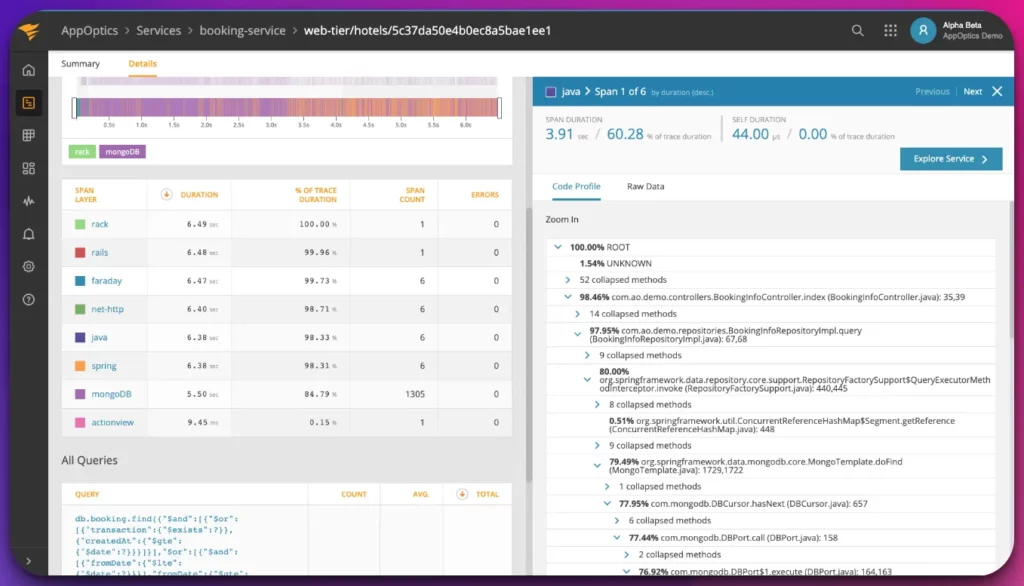
By collecting and analyzing data from various sources, SolarWinds AppOptics offers invaluable insights into application behavior, resource utilization, and performance metrics.
One of the standout features of SolarWinds AppOptics is its ability to enable distributed tracing, allowing businesses to trace requests as they traverse various microservices and components within their application infrastructure. This granular visibility helps pinpoint performance bottlenecks and optimize the overall application ecosystem.
With SolarWinds AppOptics, organizations can gain real-time insights into the behavior and performance of their cloud-native applications. The platform offers cloud-native monitoring, ensuring compatibility with modern cloud platforms and enabling businesses to scale their applications seamlessly.
Furthermore, SolarWinds AppOptics supports container monitoring, allowing organizations to monitor the performance of applications running in containerized environments. This feature provides deep visibility into container health, resource consumption, and network activity.
In conclusion, SolarWinds AppOptics is a game-changer in cloud-native monitoring.
Its advanced features, including infrastructure and application performance monitoring, distributed tracing, and container monitoring, empower organizations to optimize their cloud-based applications, enhance performance, and drive digital success.
With SolarWinds AppOptics, businesses can unleash the full potential of their cloud-native applications and stay ahead in the dynamic world of modern IT infrastructure.
Pros of SolarWinds AppOptics:-
Comprehensive Cloud-Native Monitoring: SolarWinds AppOptics offers a comprehensive suite of monitoring tools specifically designed for cloud-native applications, providing deep insights into infrastructure and application performance.
Distributed Tracing: The platform’s distributed tracing capability allows businesses to trace requests across microservices and components, enabling the identification of performance bottlenecks and optimization opportunities.
Real-Time Insights: SolarWinds AppOptics provides real-time insights into the behavior and performance of cloud-native applications, allowing organizations to proactively address issues and ensure optimal performance.
Cloud-Native Compatibility: SolarWinds AppOptics is designed to seamlessly integrate with modern cloud platforms, ensuring compatibility and scalability as businesses grow and evolve.
Container Monitoring: The platform supports container monitoring, enabling organizations to monitor the performance of applications running in containerized environments, ensuring efficient resource utilization and performance optimization.
Cons of SolarWinds AppOptics:-
Complex Configuration: Setting up and configuring SolarWinds AppOptics for complex cloud-native environments may require technical expertise and time for optimal deployment.
Learning Curve: The advanced features and terminology used in SolarWinds AppOptics may present a learning curve for new users, requiring training and familiarity to utilize the platform effectively.
Cost Considerations: SolarWinds AppOptics is a premium solution, and the pricing may be a factor for small or budget-constrained organizations.
Dependency on Agent Installation: SolarWinds AppOptics requires agents to be installed on application components and infrastructure, which can be time-consuming, especially for large-scale environments.
Limited Customization: While SolarWinds AppOptics offers extensive monitoring capabilities, some users may find limitations in customizing certain platform aspects to meet specific requirements.
Application Monitoring Best Practices
Implementing effective application monitoring best practices is crucial for businesses to ensure optimal performance, enhance reliability, and deliver exceptional user experiences.
By adhering to these practices, organizations can proactively identify and address issues, optimize resource utilization, and drive overall success in today’s digital landscape.
1. Comprehensive Monitoring Strategy
Develop a comprehensive application monitoring strategy encompassing all critical components, including infrastructure, network, databases, and user experience. This ensures holistic visibility into the application ecosystem, enabling effective performance monitoring and issue detection.
2. Set Clear Performance Baselines
Establish performance baselines to define normal behavior and set thresholds for key performance metrics such as response times, error rates, and resource utilization. This allows for early detection of anomalies and deviations from expected performance, enabling prompt action before users are affected.
3. Real-Time Monitoring
Embrace real-time monitoring to gain instant visibility into application performance. Leveraging monitoring tools that provide real-time data collection and analysis enables quick issue identification and swift resolution. It helps to detect and mitigate performance bottlenecks, errors, and abnormalities in real time.
4. End-User Experience Monitoring
Prioritize end-user experience monitoring to understand how users interact with the application. Monitor page load times, responsiveness, and user interactions to ensure a seamless experience. This type of monitoring provides insights into actual user experiences and helps identify areas for improvement.
5. Proactive Alerting
Implement proactive alerting mechanisms to receive notifications when performance metrics exceed defined thresholds. This enables prompt response to potential issues, minimizing user impact. Alerts can be configured to notify relevant stakeholders or teams responsible for issue resolution.
6. Root Cause Analysis
Perform root cause analysis to identify the underlying causes of performance issues. When an incident occurs, it is important to investigate and analyze logs, trace requests, and leverage diagnostic tools to pinpoint and address the root causes effectively. This practice helps prevent recurring issues and improve overall application performance.
7. Capacity Planning
Conduct capacity planning to forecast resource requirements based on historical data and projected growth. By understanding resource usage patterns and estimating future demand, organizations can optimize resource allocation and avoid performance bottlenecks due to inadequate capacity.
8. Continuous Optimization
Continuously optimize application performance by monitoring and fine-tuning critical components. Leverage insights from monitoring data to identify areas for improvement and implement optimizations. This includes code optimizations, database query optimizations, and infrastructure adjustments to ensure optimal performance.
9. Security Monitoring
Incorporate security monitoring as part of application monitoring best practices. Monitor for security-related events, vulnerabilities, and suspicious activities to detect and mitigate potential security breaches. This helps protect sensitive data, maintain compliance, and safeguard the application’s integrity.
10. Collaboration and Communication
Foster collaboration and effective communication among teams responsible for application monitoring, development, operations, and support. Encourage sharing of insights, lessons learned, and best practices to facilitate a holistic approach to application performance management.
In conclusion, following application monitoring best practices is essential for organizations to maintain and enhance their applications’ performance, reliability, and user experience.
By adopting a comprehensive monitoring strategy, setting performance baselines, leveraging real-time monitoring, prioritizing end-user experience, proactively alerting, conducting root cause analysis, performing capacity planning, continuously optimizing, implementing security monitoring, and promoting collaboration, businesses can ensure their applications meet the demands of users and achieve their digital objectives in a highly competitive landscape.
Types of APM Tool
Application Performance Monitoring (APM) tools play a critical role in today’s digital landscape, enabling businesses to gain deep insights into the performance and health of their applications.
These tools come in different types, each serving unique purposes and addressing specific needs. Understanding the types of APM tools available can help organizations make informed decisions when choosing the right solution for their application monitoring requirements.
Let’s explore the various APM tool types and their functionalities and benefits.
1. Code-Level APM Tools
Code-level APM tools are designed to dive deep into the application code, providing developers with a detailed understanding of how the code performs in real-time.
These tools offer visibility into code execution paths, transaction tracing, and performance bottlenecks. By capturing data at the code level, organizations can identify inefficiencies, optimize code segments, and improve overall application performance.
Code-level APM tools often integrate with development environments and provide actionable insights for developers to enhance the application’s efficiency and stability.
2. Real-User Monitoring (RUM) Tools
Real-User Monitoring (RUM) tools focus on capturing and analyzing data related to the actual experiences of end-users.
These tools monitor user interactions, including page load times, click paths, and responsiveness, providing insights into user behavior and application performance from the user’s perspective.
RUM tools help organizations understand the impact of application performance on user satisfaction and enable them to detect and address issues that may hinder the user experience. Businesses can optimize their applications by leveraging RUM tools to deliver exceptional user experiences.
3. Infrastructure APM Tools
Infrastructure APM tools monitor the underlying infrastructure components that support applications.
These tools provide visibility into server performance, network latency, database utilization, and other infrastructure metrics. By monitoring the infrastructure, organizations can identify potential bottlenecks, optimize resource allocation, and ensure the smooth operation of their applications.
Infrastructure APM tools enable businesses to proactively manage their infrastructure and prevent performance issues that could impact application availability and responsiveness.
4. Transaction Tracing APM Tools
Transaction tracing APM tools offer end-to-end visibility into individual transactions as they flow through various application architecture components.
These tools capture and analyze data related to each transaction, including service calls, database queries, and external dependencies. Transaction tracing helps organizations understand the performance of critical transactions, identify bottlenecks, and optimize the application’s overall flow.
By leveraging transaction tracing APM tools, businesses can improve transactional performance and ensure a seamless user experience.
5. Database APM Tools
Database APM tools focus specifically on monitoring the performance and health of databases. These tools analyze database query response times, transaction throughput, and resource utilization. By monitoring database performance, organizations can optimize query execution, identify slow-running queries, and address database-related issues that may impact overall application performance.
Database APM tools enable businesses to ensure efficient data retrieval, maintain data integrity, and enhance the overall application experience.
6. Mobile APM Tools
Mobile APM tools are tailored for monitoring the performance of mobile applications across different devices and operating systems.
These tools provide insights into mobile-specific metrics such as app launch times, network latency, battery consumption, and user engagement. Mobile APM tools help organizations optimize their mobile applications to deliver seamless experiences, improve responsiveness, and address device-specific challenges.
With the increasing usage of mobile devices, these tools are essential for businesses to ensure optimal performance and user satisfaction.
7. Network APM Tools
Network APM tools focus on monitoring and analyzing network performance and traffic. These tools capture network metrics such as latency, packet loss, and bandwidth utilization.
Network APM tools help organizations identify network bottlenecks, detect potential network-related issues, and ensure efficient data transfer between application components.
Businesses can optimize network configurations, address performance issues, and maintain a reliable application experience by monitoring the network.
8. Cloud APM Tools
Cloud APM tools are designed to monitor and optimize applications deployed in cloud environments. These tools provide visibility into cloud-specific metrics, including resource utilization, auto-scaling performance, and cost optimization.
Cloud APM tools help organizations ensure that their cloud-based applications perform optimally, dynamically scale resources based on demand, and manage costs efficiently.
With the growing adoption of cloud computing, these tools have become essential for businesses to maximize the benefits of cloud deployments.
9. Synthetic Monitoring Tools
Synthetic monitoring tools simulate user interactions with the application by generating artificial transactions. These tools periodically test the application’s performance and availability from different locations.
Synthetic monitoring helps organizations proactively identify performance issues, detect potential downtime, and ensure critical functionality works as expected. By simulating user behavior, businesses can gain insights into the application’s responsiveness and address performance bottlenecks before real users are impacted.
10. Log Analysis Tools
Log analysis tools analyze application logs to identify patterns, errors, and anomalies.
These tools aggregate and analyze log data from various sources to provide insights into application behavior, system errors, and performance-related events. Log analysis tools enable organizations to troubleshoot issues, perform root cause analysis, and gain valuable information for improving application performance and stability.
In conclusion, the diverse APM tools cater to different aspects of application performance monitoring. Each type offers specific functionalities and benefits, empowering organizations to monitor, analyze, and optimize their applications effectively.
By leveraging the appropriate types of APM tools based on their specific requirements, businesses can proactively detect performance issues, improve user experiences, and ensure the overall success of their applications in today’s dynamic digital landscape.
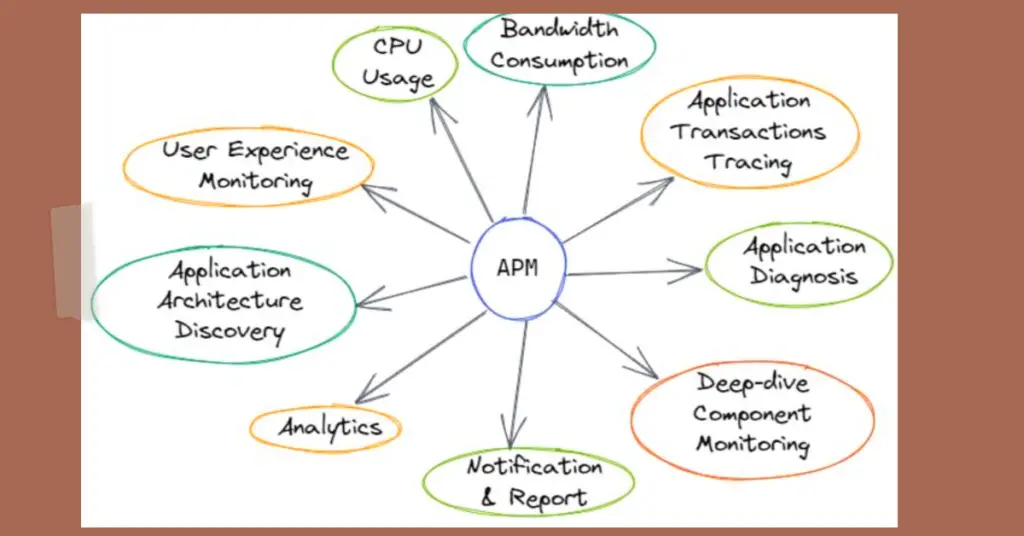
How does APM Work?
Let’s delve into the inner workings of APM and explore the key components and processes involved.
1. Data Collection and Instrumentation
APM starts with collecting data from various sources within an application ecosystem. Data collection involves the instrumentation of application code, infrastructure components, and network layers to capture relevant performance metrics. APM tools use agents or software libraries to gather information about transaction execution, resource consumption, and external dependencies.
2. Performance Metrics and Monitoring
Once the data is collected, APM tools analyze and monitor key performance metrics. These performance metrics may include response times, throughput, error rates, CPU and memory utilization, database query times, and network latency. Real-time monitoring allows organizations to track these metrics continuously, providing valuable insights into the health and performance of their applications.
3. Transaction Tracing
One crucial aspect of APM is transaction tracing, which provides end-to-end visibility into the flow of individual transactions across various application components. By tracing transactions, APM tools can identify performance bottlenecks, detect dependencies, and analyze the impact of each transaction on the overall application performance.
4. Code-Level Analysis
APM tools often offer code-level analysis, allowing organizations to dive deep into the application code to identify performance issues.
Code-level analysis helps pinpoint inefficient algorithms, resource leaks, or other areas that may impact performance. By providing developers with insights into code performance, APM tools enable them to optimize and fine-tune the application for better efficiency.
5. Real-User Monitoring (RUM)
Real-User Monitoring (RUM) is a vital component of APM that focuses on capturing data from user interactions with the application. By monitoring user experiences, APM tools measure metrics such as page load times, click paths, and user engagement.
RUM provides organizations with valuable insights into how end-users perceive and interact with their applications, helping them identify areas for improvement and optimize user experiences.
6. Alerting and Anomaly Detection
APM tools incorporate alerting and anomaly detection mechanisms to proactively identify performance issues or deviations from expected behavior. Organizations can define thresholds for key performance metrics; alerts are triggered when those thresholds are breached.
Anomaly detection algorithms help identify abnormal patterns or outliers in the data, enabling early detection and prompt resolution of performance issues.
7. Root Cause Analysis
APM tools facilitate root cause analysis when performance issues occur by correlating data from different sources. By examining logs, tracing transactions, and analyzing performance metrics, APM tools help identify the underlying causes of performance bottlenecks or errors.
Root cause analysis is crucial for effective troubleshooting and problem resolution, enabling organizations to address the underlying issues instead of just the symptoms.
8. Visualization and Reporting
APM tools provide visualization and reporting capabilities to present performance data meaningfully and actionable.
Dashboards and visualizations offer a consolidated view of performance metrics, allowing organizations to monitor trends, identify patterns, and make informed decisions. Reports and insights generated by APM tools help stakeholders understand the application’s performance, make optimizations, and track improvements over time.
9. Integration and Collaboration
To maximize the effectiveness of APM, integration and collaboration are essential. APM tools often integrate with other monitoring systems, logging frameworks, and collaboration platforms to consolidate data and enable cross-team collaboration.
By bringing together different stakeholders, including developers, operations teams, and business owners, APM fosters effective communication, knowledge sharing, and collaboration to drive application performance improvements.
10. Continuous Improvement and Optimization
APM is not a one-time implementation but an ongoing process. Organizations leverage APM tools for continuous improvement and optimization of their applications.
By monitoring performance, analyzing data, and acting on insights, organizations can identify areas for enhancement, make targeted optimizations, and continuously refine their applications for better performance, user experience, and business outcomes.
In conclusion, APM collects data, monitors performance metrics, tracks transactions, analyzes code, monitors real-user experiences, detects anomalies, performs root cause analysis, visualizes data, and facilitates collaboration.
By harnessing the power of APM, organizations can gain actionable insights, optimize application performance, and deliver exceptional user experiences in today’s dynamic digital landscape.
📗FAQ’s
Why is APM required?
Simply put, it empowers organizations to gain deep insights into their application performance, identify and resolve bottlenecks, and deliver exceptional user experiences.
APM provides a comprehensive suite of tools and methodologies to monitor, analyze, and optimize application performance.
It allows businesses to track vital performance metrics, such as response times, throughput, and resource utilization, ensuring applications meet the demands of users and perform optimally. One of the key reasons APM is required is its ability to detect and diagnose performance issues.
With real-time monitoring and diagnostics, APM enables organizations to identify bottlenecks, errors, and latency sources within their applications, facilitating quick resolution and minimizing downtime.
Moreover, APM plays a crucial role in enhancing user experiences. By gaining insights into how users interact with applications, businesses can identify areas for improvement, optimize workflows, and deliver seamless experiences, leading to increased customer satisfaction and loyalty.
Additionally, APM aids in optimizing resource utilization. By analyzing performance data, businesses can identify areas of inefficiency, such as underutilized resources or poorly performing code, and take corrective measures to optimize resource allocation, resulting in cost savings and improved overall efficiency.
In conclusion, APM is required to ensure that applications meet users’ expectations and perform at their best.
By monitoring performance, diagnosing issues, and optimizing resource utilization, organizations can unlock the full potential of their applications, drive user satisfaction, and achieve their business objectives.
Conclusion
Application monitoring is a critical practice in modern software development and operations.
By systematically observing and analyzing application behavior, performance, and health, organizations can optimize performance, ensure user satisfaction, detect and resolve issues proactively, enhance security, and optimize costs.
Understanding the importance of application monitoring and leveraging appropriate techniques and tools enables businesses to deliver robust, reliable, high-performing applications that drive success in today’s competitive digital landscape.